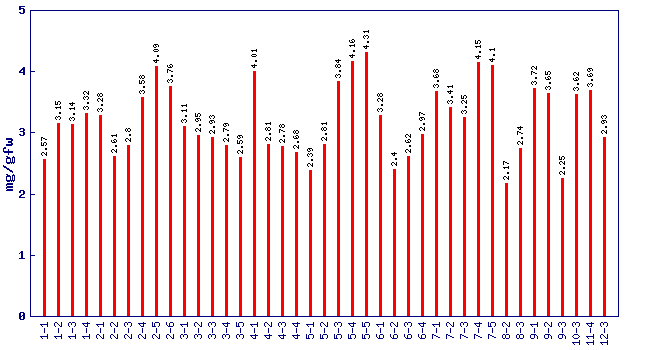
citric acid concentration (mg/gfw)*
Experiment: flavor related metabolite profiling in S. pennellii IL lines (FL, Spring 2001, Field)
|
| line | content (mg/gfw) |
|---|
| 1-1 |
2.57 + 0.045 |
| 1-2 |
3.15 + 0.21 |
| 1-3 |
3.14 + 0.225 |
| 1-4 |
3.32 + 0.09 |
| 2-1 |
3.28 + 0.007 |
| 2-2 |
2.61 + 0.135 |
| 2-3 |
2.8 + 0.097 |
| 2-4 |
3.58 + 0.097 |
| 2-5 |
4.09 + 0.337 |
| 2-6 |
3.76 + 0.142 |
| 3-1 |
3.11 |
| 3-2 |
2.95 + 0.007 |
| 3-3 |
2.93 + 0.127 |
| 3-4 |
2.79 + 0.06 |
| 3-5 |
2.59 + 0.052 |
| 4-1 |
4.01 + 0.03 |
| 4-2 |
2.81 + 0.03 |
| 4-3 |
2.78 + 0.187 |
| 4-4 |
2.68 + 0.082 |
| 5-1 |
2.39 + 0.097 |
| 5-2 |
2.81 |
| 5-3 |
3.84 + 0.24 |
| 5-4 |
4.16 + 0.135 |
| 5-5 |
4.31 + 0.03 |
| 6-1 |
3.28 + 0.022 |
| 6-2 |
2.4 + 0.045 |
| 6-3 |
2.62 + 0.022 |
| 6-4 |
2.97 + 0.21 |
| 7-1 |
3.68 + 0.022 |
| 7-2 |
3.41 + 0.037 |
| 7-3 |
3.25 + 0.007 |
| 7-4 |
4.15 + 0.157 |
| 7-5 |
4.1 + 0.045 |
| 8-2 |
2.17 + 0.112 |
| 8-3 |
2.74 + 0.037 |
| 9-1 |
3.72 + 0.09 |
| 9-2 |
3.65 + 0.127 |
| 9-3 |
2.25 + 0.045 |
| 10-3 |
3.62 + 0.03 |
| 11-4 |
3.69 + 0.06 |
| 12-3 |
2.93 + 0.023 |
* Note
- A value of zero means the citric acid concentration was below the level of dection
- No measure of citric acid was performed on lines not shown in the figure and table
|
|