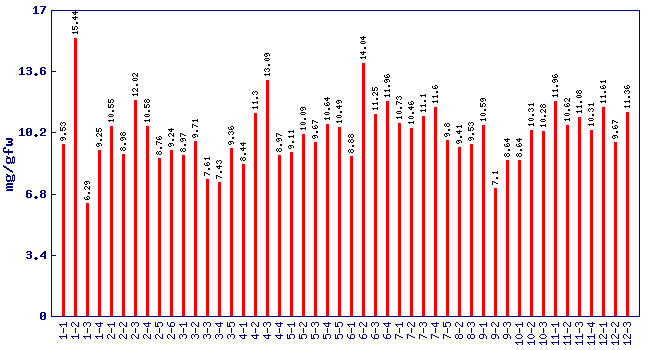
fructose concentration (mg/gfw)*
Experiment: flavor related metabolite profiling in S. pennellii IL lines (FL, Spring 2001, Field)
|
| line | content (mg/gfw) |
|---|
| 1-1 |
9.53 + 0.458 |
| 1-2 |
15.44 + 0.653 |
| 1-3 |
6.29 + 1.11 |
| 1-4 |
9.25 + 0.113 |
| 2-1 |
10.55 + 0.3 |
| 2-2 |
8.98 + 0.413 |
| 2-3 |
12.02 + 0.285 |
| 2-4 |
10.58 + 0.833 |
| 2-5 |
8.76 + 0.615 |
| 2-6 |
9.24 + 1.05 |
| 3-1 |
8.97 + 0.105 |
| 3-2 |
9.71 + 0.135 |
| 3-3 |
7.61 + 0.353 |
| 3-4 |
7.43 + 0.083 |
| 3-5 |
9.36 + 0.36 |
| 4-1 |
8.44 + 0.098 |
| 4-2 |
11.3 + 0.023 |
| 4-3 |
13.09 + 0.638 |
| 4-4 |
8.97 + 0.195 |
| 5-1 |
9.11 + 0.405 |
| 5-2 |
10.09 + 0.533 |
| 5-3 |
9.67 + 0.458 |
| 5-4 |
10.64 + 0.42 |
| 5-5 |
10.49 + 0.195 |
| 6-1 |
8.88 + 0.06 |
| 6-2 |
14.04 + 0.105 |
| 6-3 |
11.25 + 0.135 |
| 6-4 |
11.96 + 1.11 |
| 7-1 |
10.73 + 0.053 |
| 7-2 |
10.46 + 0.053 |
| 7-3 |
11.1 + 0.3 |
| 7-4 |
11.6 |
| 7-5 |
9.8 + 0.315 |
| 8-2 |
9.41 + 0.585 |
| 8-3 |
9.53 + 0.15 |
| 9-1 |
10.59 + 0.21 |
| 9-2 |
7.1 + 0.188 |
| 9-3 |
8.64 + 0.105 |
| 10-1 |
8.64 + 0.18 |
| 10-2 |
10.31 + 0.825 |
| 10-3 |
10.28 + 0.03 |
| 11-1 |
11.96 + 0.293 |
| 11-2 |
10.62 + 0.75 |
| 11-3 |
11.08 + 0.173 |
| 11-4 |
10.31 + 0.345 |
| 12-1 |
11.61 + 0.15 |
| 12-2 |
9.67 + 0.413 |
| 12-3 |
11.36 + 0.203 |
* Note
- A value of zero means the fructose concentration was below the level of dection
- No measure of fructose was performed on lines not shown in the figure and table
|
|