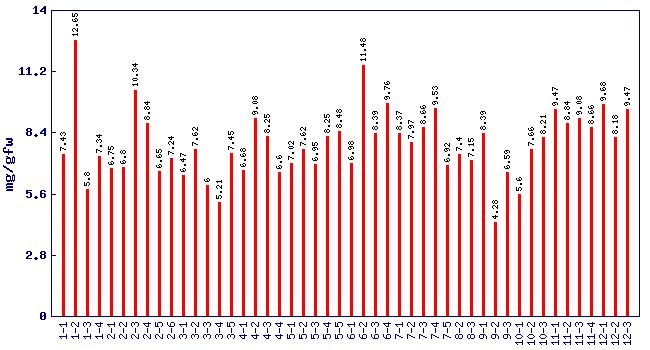
glucose concentration (mg/gfw)*
Experiment: flavor related metabolite profiling in S. pennellii IL lines (FL, Spring 2001, Field)
|
| line | content (mg/gfw) |
|---|
| 1-1 |
7.43 + 0.368 |
| 1-2 |
12.65 + 0.488 |
| 1-3 |
5.8 + 1.028 |
| 1-4 |
7.34 + 0.12 |
| 2-1 |
6.75 + 0.21 |
| 2-2 |
6.8 + 0.293 |
| 2-3 |
10.34 + 0.27 |
| 2-4 |
8.84 + 0.713 |
| 2-5 |
6.65 + 0.473 |
| 2-6 |
7.24 + 0.833 |
| 3-1 |
6.47 + 0.075 |
| 3-2 |
7.62 + 0.135 |
| 3-3 |
6 + 0.285 |
| 3-4 |
5.21 + 0.045 |
| 3-5 |
7.45 + 0.293 |
| 4-1 |
6.68 + 0.038 |
| 4-2 |
9.08 + 0.015 |
| 4-3 |
8.25 + 0.39 |
| 4-4 |
6.6 + 0.165 |
| 5-1 |
7.02 + 0.3 |
| 5-2 |
7.62 + 0.405 |
| 5-3 |
6.95 + 0.345 |
| 5-4 |
8.25 + 0.33 |
| 5-5 |
8.48 + 0.18 |
| 6-1 |
6.98 + 0.075 |
| 6-2 |
11.48 + 0.128 |
| 6-3 |
8.39 + 0.038 |
| 6-4 |
9.76 + 0.908 |
| 7-1 |
8.37 + 0.045 |
| 7-2 |
7.97 + 0.045 |
| 7-3 |
8.66 + 0.24 |
| 7-4 |
9.53 |
| 7-5 |
6.92 + 0.225 |
| 8-2 |
7.4 + 0.458 |
| 8-3 |
7.15 + 0.098 |
| 9-1 |
8.39 + 0.195 |
| 9-2 |
4.28 + 0.113 |
| 9-3 |
6.59 + 0.083 |
| 10-1 |
5.6 + 0.128 |
| 10-2 |
7.66 + 0.623 |
| 10-3 |
8.21 + 0.098 |
| 11-1 |
9.47 + 0.203 |
| 11-2 |
8.84 + 0.645 |
| 11-3 |
9.08 + 0.158 |
| 11-4 |
8.66 + 0.188 |
| 12-1 |
9.68 + 0.135 |
| 12-2 |
8.18 + 0.375 |
| 12-3 |
9.47 + 0.158 |
* Note
- A value of zero means the glucose concentration was below the level of dection
- No measure of glucose was performed on lines not shown in the figure and table
|
|