 |
 |
 |
 |
 |
 |
 |
 |
 |
 |
 |
 |
| Relative 1,2,3-trimethylbenzene level (percent of control)* Experiment: flavor related metabolite profiling in S. pennellii IL lines (FL, Fall 2002, Greenhouse) |
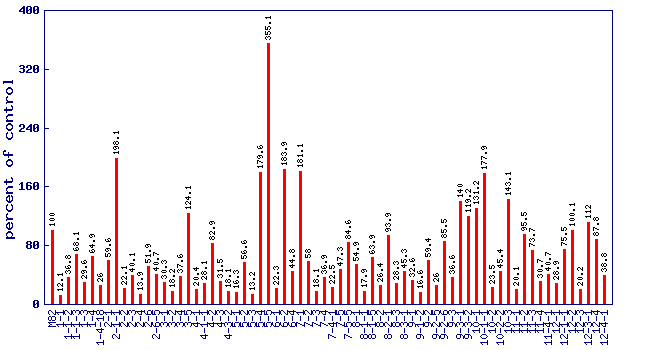 |
| line | relative level (percent of control) |
|---|---|
| M82 | 100 |
| 1-1 | 12.1 |
| 1-1-2 | 36.8 |
| 1-1-3 | 68.1 |
| 1-3 | 29.6 |
| 1-4 | 64.9 |
| 1-4-18 | 26 |
| 2-1 | 59.6 |
| 2-1-1 | 198.1 |
| 2-2 | 22.1 |
| 2-3 | 40.1 |
| 2-4 | 13.9 |
| 2-6 | 51.9 |
| 2-6-5 | 40.7 |
| 3-1 | 30.3 |
| 3-2 | 18.2 |
| 3-4 | 37.6 |
| 3-5 | 124.1 |
| 4-1 | 20.4 |
| 4-1-1 | 28.1 |
| 4-2 | 82.9 |
| 4-3 | 31.5 |
| 4-3-2 | 18.1 |
| 5-1 | 16.3 |
| 5-2 | 56.6 |
| 5-3 | 13.2 |
| 5-4 | 179.6 |
| 5-5 | 355.1 |
| 6-1 | 22.3 |
| 6-2 | 183.9 |
| 6-4 | 44.8 |
| 7-1 | 181.1 |
| 7-2 | 58 |
| 7-3 | 18.1 |
| 7-4 | 36.9 |
| 7-4-1 | 22.5 |
| 7-5 | 47.3 |
| 7-5-5 | 84.6 |
| 8-1 | 54.9 |
| 8-1-1 | 17.9 |
| 8-1-5 | 63.9 |
| 8-2 | 26.4 |
| 8-2-1 | 93.9 |
| 8-3 | 28.3 |
| 8-3-1 | 45.3 |
| 9-1 | 32.6 |
| 9-1-2 | 16.6 |
| 9-2 | 59.4 |
| 9-2-5 | 26 |
| 9-2-6 | 85.5 |
| 9-3 | 36.6 |
| 9-3-1 | 140 |
| 9-3-2 | 119.2 |
| 10-1 | 131.2 |
| 10-1-1 | 177.9 |
| 10-2 | 23.5 |
| 10-2-2 | 45.4 |
| 10-3 | 143.1 |
| 11-1 | 20.1 |
| 11-2 | 95.5 |
| 11-3 | 73.7 |
| 11-4 | 30.7 |
| 11-4-1 | 40.7 |
| 12-1 | 28.9 |
| 12-1-1 | 75.5 |
| 12-2 | 100.1 |
| 12-3 | 20.2 |
| 12-3-1 | 112 |
| 12-4 | 87.8 |
| 12-4-1 | 38.8 |
* Note
|