 |
 |
 |
 |
 |
 |
 |
 |
 |
 |
 |
 |
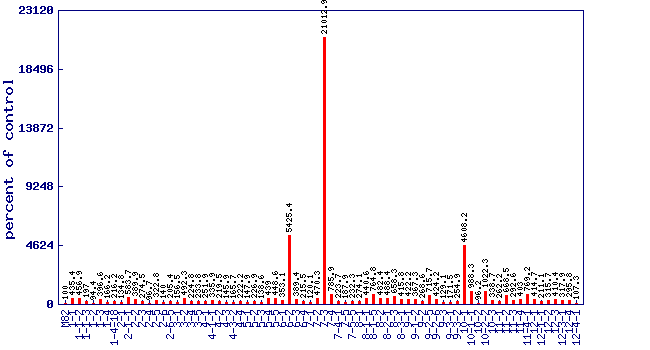
| Relative 1,2,3-trimethylbenzene level (percent of control)* Experiment: flavor related metabolite profiling in S. pennellii IL lines (FL, Spring 2003, Field) |
 |
| line | relative level (percent of control) |
|---|---|
| M82 | 100 |
| 1-1 | 435.4 |
| 1-1-2 | 456.9 |
| 1-1-3 | 197 |
| 1-2 | 94.4 |
| 1-3 | 396.6 |
| 1-4 | 166.2 |
| 1-4-18 | 216.2 |
| 2-1 | 134.8 |
| 2-1-1 | 583.7 |
| 2-2 | 389.9 |
| 2-3 | 274.5 |
| 2-4 | 96.7 |
| 2-5 | 322.8 |
| 2-6 | 140 |
| 2-6-5 | 205.4 |
| 3-1 | 156.5 |
| 3-2 | 492.3 |
| 3-4 | 224.8 |
| 3-5 | 233.8 |
| 4-1 | 251.9 |
| 4-1-1 | 335.9 |
| 4-2 | 219.5 |
| 4-3 | 145.9 |
| 4-3-2 | 165.7 |
| 4-4 | 222.2 |
| 5-1 | 147.9 |
| 5-2 | 226.9 |
| 5-3 | 138.6 |
| 5-4 | 439 |
| 5-5 | 448.6 |
| 6-1 | 353.1 |
| 6-2 | 5425.4 |
| 6-3 | 389.4 |
| 6-4 | 215.5 |
| 7-1 | 120.1 |
| 7-2 | 470.3 |
| 7-3 | 21012.9 |
| 7-4 | 785.9 |
| 7-4-1 | 223.7 |
| 7-5 | 187.9 |
| 7-5-5 | 232.3 |
| 8-1 | 274.1 |
| 8-1-1 | 440.6 |
| 8-1-5 | 764.8 |
| 8-2 | 482.4 |
| 8-2-1 | 488.4 |
| 8-3 | 658.3 |
| 8-3-1 | 415.8 |
| 9-1 | 422.2 |
| 9-1-2 | 367.3 |
| 9-2 | 268.6 |
| 9-2-5 | 715.7 |
| 9-2-6 | 424.2 |
| 9-3 | 129.1 |
| 9-3-1 | 171.5 |
| 9-3-2 | 254.9 |
| 10-1 | 4608.2 |
| 10-1-1 | 988.3 |
| 10-2 | 96.2 |
| 10-2-2 | 1022.3 |
| 10-3 | 338.7 |
| 11-1 | 262.2 |
| 11-2 | 668.5 |
| 11-3 | 292.6 |
| 11-4 | 403 |
| 11-4-1 | 769.2 |
| 12-1 | 414.7 |
| 12-1-1 | 211.1 |
| 12-2 | 315.7 |
| 12-3 | 410.4 |
| 12-3-1 | 317.9 |
| 12-4 | 295.8 |
| 12-4-1 | 107.3 |
* Note
|