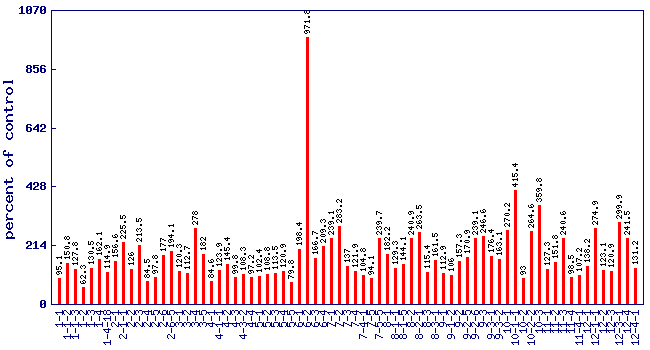
Relative 1,2,3-trimethylbenzene level (percent of control)*
Experiment: flavor related metabolite profiling in S. pennellii IL lines (combined)
|
 |
| line | relative level (percent of control) | p value | FDR |
|---|
| 1-1 | 95.1 | 0.909519 | 0.960511 |
| 1-1-2 | 150.8 | 0.340264 | 0.623906 |
| 1-1-3 | 127.8 | 0.556343 | 0.802359 |
| 1-2 | 62.3 | 0.407583 | 0.67983 |
| 1-3 | 130.5 | 0.549545 | 0.796834 |
| 1-4 | 162.1 | 0.315192 | 0.599857 |
| 1-4-18 | 114.9 | 0.747207 | 0.902305 |
| 2-1 | 156.6 | 0.400366 | 0.676264 |
| 2-1-1 | 225.5 | 0.0401783 | 0.162784 |
| 2-2 | 126 | 0.647134 | 0.852958 |
| 2-3 | 213.5 | 0.132649 | 0.363694 |
| 2-4 | 84.5 | 0.767995 | 0.904914 |
| 2-5 | 97.8 | 0.962501 | 0.982927 |
| 2-6 | 177 | 0.215936 | 0.489316 |
| 2-6-5 | 194.1 | 0.167596 | 0.417785 |
| 3-1 | 120.3 | 0.700278 | 0.874858 |
| 3-2 | 112.7 | 0.763234 | 0.902305 |
| 3-4 | 278 | 0.0274819 | 0.126567 |
| 3-5 | 182 | 0.115216 | 0.337009 |
| 4-1 | 84.6 | 0.696528 | 0.871395 |
| 4-1-1 | 123.9 | 0.656192 | 0.858179 |
| 4-2 | 145.4 | 0.384282 | 0.662179 |
| 4-3 | 99.8 | 0.995837 | 0.997512 |
| 4-3-2 | 108.3 | 0.836912 | 0.935279 |
| 4-4 | 97.2 | 0.950468 | 0.978265 |
| 5-1 | 102.4 | 0.956823 | 0.980526 |
| 5-2 | 108.8 | 0.831762 | 0.933165 |
| 5-3 | 113.5 | 0.755551 | 0.902305 |
| 5-4 | 120.9 | 0.706281 | 0.877095 |
| 5-5 | 79.8 | 0.588636 | 0.822289 |
| 6-1 | 198.4 | 0.266432 | 0.551049 |
| 6-2 | 971.8 | 0.0156591 | 0.08724 |
| 6-3 | 166.7 | 0.34103 | 0.624825 |
| 6-4 | 209.3 | 0.165895 | 0.416592 |
| 7-1 | 239.1 | 0.0500867 | 0.18717 |
| 7-2 | 283.2 | 0.0912954 | 0.285889 |
| 7-3 | 137 | 0.452074 | 0.718806 |
| 7-4 | 121.9 | 0.645296 | 0.852442 |
| 7-4-1 | 104.8 | 0.900871 | 0.956362 |
| 7-5 | 94.1 | 0.87639 | 0.94748 |
| 7-5-5 | 239.7 | 0.0584098 | 0.207501 |
| 8-1 | 182.2 | 0.141477 | 0.378114 |
| 8-1-1 | 129.3 | 0.498769 | 0.759262 |
| 8-1-5 | 144.1 | 0.326973 | 0.610937 |
| 8-2 | 240.9 | 0.153582 | 0.395961 |
| 8-2-1 | 263.5 | 0.00316871 | 0.0278799 |
| 8-3 | 115.4 | 0.730732 | 0.891856 |
| 8-3-1 | 161.5 | 0.250561 | 0.530839 |
| 9-1 | 112.9 | 0.753041 | 0.902305 |
| 9-1-2 | 106 | 0.903578 | 0.958021 |
| 9-2 | 157.3 | 0.176147 | 0.432602 |
| 9-2-5 | 170.9 | 0.157576 | 0.402917 |
| 9-2-6 | 239.1 | 0.0588612 | 0.207501 |
| 9-3 | 246.6 | 0.035808 | 0.149443 |
| 9-3-1 | 176.4 | 0.126763 | 0.3567 |
| 9-3-2 | 163.1 | 0.149859 | 0.391775 |
| 10-1 | 270.2 | 0.0103502 | 0.0647365 |
| 10-1-1 | 415.4 | 0.000682897 | 0.00763162 |
| 10-2 | 93 | 0.885102 | 0.951263 |
| 10-2-2 | 264.6 | 0.0874981 | 0.276569 |
| 10-3 | 359.8 | 0.00784137 | 0.0519381 |
| 11-1 | 127.3 | 0.6005 | 0.826843 |
| 11-2 | 151.8 | 0.280886 | 0.568078 |
| 11-3 | 240.6 | 0.081797 | 0.266038 |
| 11-4 | 98.5 | 0.969763 | 0.983185 |
| 11-4-1 | 107.2 | 0.858274 | 0.939302 |
| 12-1 | 138.2 | 0.451792 | 0.718806 |
| 12-1-1 | 274.9 | 0.0357383 | 0.149417 |
| 12-2 | 123.1 | 0.55719 | 0.803089 |
| 12-3 | 120.9 | 0.597088 | 0.826252 |
| 12-3-1 | 299.9 | 0.00706666 | 0.0485807 |
| 12-4 | 241.5 | 0.0405228 | 0.163618 |
| 12-4-1 | 131.2 | 0.515608 | 0.77096 |
* Note
- A value of zero means the 1,2,3-trimethylbenzene concentration wasbelow the level of dection
- No measure of 1,2,3-trimethylbenzene was performed on lines notshown in the figure and table
|
|


