 |
 |
 |
 |
 |
 |
 |
 |
 |
 |
 |
 |
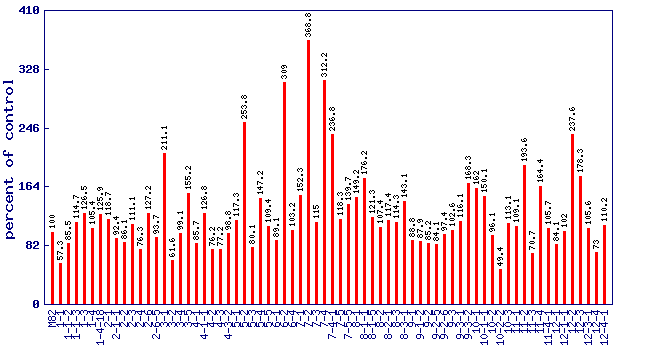
| Relative 1-pentanol level (percent of control)* Experiment: flavor related metabolite profiling in S. pennellii IL lines (FL, Fall 2002, Greenhouse) |
 |
| line | relative level (percent of control) |
|---|---|
| M82 | 100 |
| 1-1 | 57.3 |
| 1-1-2 | 85.5 |
| 1-1-3 | 114.7 |
| 1-3 | 126.5 |
| 1-4 | 105.4 |
| 1-4-18 | 125.9 |
| 2-1 | 118.7 |
| 2-1-1 | 92.4 |
| 2-2 | 86.1 |
| 2-3 | 111.1 |
| 2-4 | 76.3 |
| 2-6 | 127.2 |
| 2-6-5 | 93.7 |
| 3-1 | 211.1 |
| 3-2 | 61.6 |
| 3-4 | 99.1 |
| 3-5 | 155.2 |
| 4-1 | 85.7 |
| 4-1-1 | 126.8 |
| 4-2 | 76.2 |
| 4-3 | 77.2 |
| 4-3-2 | 98.8 |
| 5-1 | 117.3 |
| 5-2 | 253.8 |
| 5-3 | 80.1 |
| 5-4 | 147.2 |
| 5-5 | 109.4 |
| 6-1 | 89.1 |
| 6-2 | 309 |
| 6-4 | 103.2 |
| 7-1 | 152.3 |
| 7-2 | 368.8 |
| 7-3 | 115 |
| 7-4 | 312.2 |
| 7-4-1 | 236.8 |
| 7-5 | 118.3 |
| 7-5-5 | 139.7 |
| 8-1 | 149.2 |
| 8-1-1 | 176.2 |
| 8-1-5 | 121.3 |
| 8-2 | 107.4 |
| 8-2-1 | 117.4 |
| 8-3 | 114.3 |
| 8-3-1 | 143.1 |
| 9-1 | 88.8 |
| 9-1-2 | 87.9 |
| 9-2 | 85.2 |
| 9-2-5 | 84.1 |
| 9-2-6 | 97.4 |
| 9-3 | 102.6 |
| 9-3-1 | 116.1 |
| 9-3-2 | 168.3 |
| 10-1 | 162 |
| 10-1-1 | 150.1 |
| 10-2 | 96.1 |
| 10-2-2 | 49.4 |
| 10-3 | 113.1 |
| 11-1 | 109.1 |
| 11-2 | 193.6 |
| 11-3 | 70.7 |
| 11-4 | 164.4 |
| 11-4-1 | 105.7 |
| 12-1 | 84.1 |
| 12-1-1 | 102 |
| 12-2 | 237.6 |
| 12-3 | 178.3 |
| 12-3-1 | 105.6 |
| 12-4 | 73 |
| 12-4-1 | 110.2 |
* Note
|