 |
 |
 |
 |
 |
 |
 |
 |
 |
 |
 |
 |
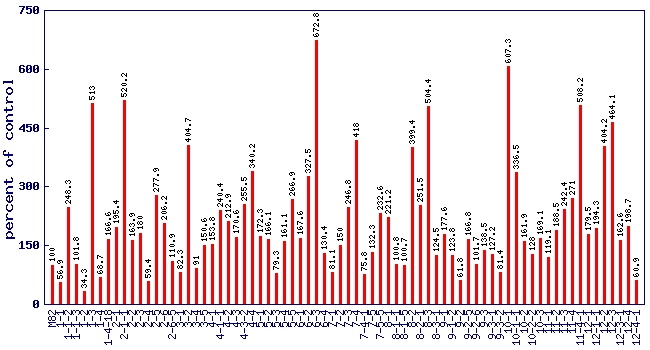
| Relative 1-pentanol level (percent of control)* Experiment: flavor related metabolite profiling in S. pennellii IL lines (FL, Spring 2003, Field) |
 |
| line | relative level (percent of control) |
|---|---|
| M82 | 100 |
| 1-1 | 56.9 |
| 1-1-2 | 248.3 |
| 1-1-3 | 101.8 |
| 1-2 | 34.3 |
| 1-3 | 513 |
| 1-4 | 68.7 |
| 1-4-18 | 166.6 |
| 2-1 | 195.4 |
| 2-1-1 | 520.2 |
| 2-2 | 163.9 |
| 2-3 | 180 |
| 2-4 | 59.4 |
| 2-5 | 277.9 |
| 2-6 | 206.2 |
| 2-6-5 | 110.9 |
| 3-1 | 82.3 |
| 3-2 | 404.7 |
| 3-4 | 91 |
| 3-5 | 150.6 |
| 4-1 | 153.8 |
| 4-1-1 | 240.4 |
| 4-2 | 212.9 |
| 4-3 | 170.6 |
| 4-3-2 | 255.5 |
| 4-4 | 340.2 |
| 5-1 | 172.3 |
| 5-2 | 166.1 |
| 5-3 | 79.3 |
| 5-4 | 161.1 |
| 5-5 | 266.9 |
| 6-1 | 167.6 |
| 6-2 | 327.5 |
| 6-3 | 672.8 |
| 6-4 | 130.4 |
| 7-1 | 81.1 |
| 7-2 | 150 |
| 7-3 | 246.8 |
| 7-4 | 418 |
| 7-4-1 | 75.8 |
| 7-5 | 132.3 |
| 7-5-5 | 232.6 |
| 8-1 | 221.2 |
| 8-1-1 | 100.8 |
| 8-1-5 | 100.7 |
| 8-2 | 399.4 |
| 8-2-1 | 251.5 |
| 8-3 | 504.4 |
| 8-3-1 | 124.5 |
| 9-1 | 177.6 |
| 9-1-2 | 123.8 |
| 9-2 | 61.8 |
| 9-2-5 | 166.8 |
| 9-2-6 | 101.7 |
| 9-3 | 138.5 |
| 9-3-1 | 127.2 |
| 9-3-2 | 81.4 |
| 10-1 | 607.3 |
| 10-1-1 | 336.5 |
| 10-2 | 161.9 |
| 10-2-2 | 128 |
| 10-3 | 169.1 |
| 11-1 | 119.1 |
| 11-2 | 188.5 |
| 11-3 | 242.4 |
| 11-4 | 271 |
| 11-4-1 | 508.2 |
| 12-1 | 179.5 |
| 12-1-1 | 194.3 |
| 12-2 | 404.2 |
| 12-3 | 464.1 |
| 12-3-1 | 162.6 |
| 12-4 | 198.7 |
| 12-4-1 | 60.9 |
* Note
|