Relative 1-pentanol level (percent of control)*
Experiment: flavor related metabolite profiling in S. pennellii IL lines (combined)
|
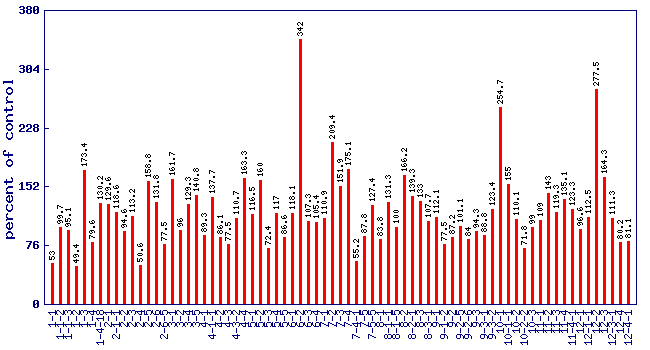 |
| line | relative level (percent of control) | p value | FDR |
|---|
| 1-1 | 53 | 0.0189438 | 0.0994866 |
| 1-1-2 | 99.7 | 0.991439 | 0.996086 |
| 1-1-3 | 95.1 | 0.843371 | 0.936608 |
| 1-2 | 49.4 | 0.0426486 | 0.169588 |
| 1-3 | 173.4 | 0.0416757 | 0.167244 |
| 1-4 | 79.6 | 0.435443 | 0.706658 |
| 1-4-18 | 130.2 | 0.312395 | 0.599025 |
| 2-1 | 129.6 | 0.423715 | 0.693833 |
| 2-1-1 | 118.6 | 0.47898 | 0.745673 |
| 2-2 | 94.6 | 0.856725 | 0.939302 |
| 2-3 | 113.2 | 0.685281 | 0.867827 |
| 2-4 | 50.6 | 0.0487593 | 0.183959 |
| 2-5 | 158.8 | 0.115432 | 0.337009 |
| 2-6 | 131.8 | 0.324259 | 0.608275 |
| 2-6-5 | 77.5 | 0.381622 | 0.660677 |
| 3-1 | 161.7 | 0.10032 | 0.306814 |
| 3-2 | 96 | 0.86409 | 0.941546 |
| 3-4 | 129.3 | 0.361503 | 0.644799 |
| 3-5 | 140.8 | 0.138724 | 0.374283 |
| 4-1 | 89.3 | 0.663586 | 0.860609 |
| 4-1-1 | 137.7 | 0.274048 | 0.559485 |
| 4-2 | 86.1 | 0.566909 | 0.809159 |
| 4-3 | 77.5 | 0.279229 | 0.566142 |
| 4-3-2 | 110.7 | 0.665123 | 0.860843 |
| 4-4 | 163.3 | 0.0825187 | 0.267279 |
| 5-1 | 116.5 | 0.571206 | 0.811387 |
| 5-2 | 160 | 0.0513061 | 0.190341 |
| 5-3 | 72.4 | 0.190848 | 0.455026 |
| 5-4 | 117 | 0.608001 | 0.830149 |
| 5-5 | 86.6 | 0.571201 | 0.811387 |
| 6-1 | 118.1 | 0.6566 | 0.858179 |
| 6-2 | 342 | 0.0314031 | 0.137674 |
| 6-3 | 107.3 | 0.809508 | 0.919837 |
| 6-4 | 105.4 | 0.871527 | 0.946597 |
| 7-1 | 110.9 | 0.701382 | 0.87516 |
| 7-2 | 209.4 | 0.0485025 | 0.183893 |
| 7-3 | 151.9 | 0.100682 | 0.307356 |
| 7-4 | 175.1 | 0.0322837 | 0.140429 |
| 7-4-1 | 55.2 | 0.0100189 | 0.0629988 |
| 7-5 | 87.8 | 0.57987 | 0.816371 |
| 7-5-5 | 127.4 | 0.386988 | 0.665586 |
| 8-1 | 83.8 | 0.474553 | 0.742159 |
| 8-1-1 | 131.3 | 0.236864 | 0.514296 |
| 8-1-5 | 100 | 0.998911 | 0.999335 |
| 8-2 | 166.2 | 0.174602 | 0.43021 |
| 8-2-1 | 139.3 | 0.0957745 | 0.294441 |
| 8-3 | 133 | 0.261207 | 0.546926 |
| 8-3-1 | 107.7 | 0.770241 | 0.904914 |
| 9-1 | 112.1 | 0.628133 | 0.842033 |
| 9-1-2 | 77.5 | 0.381892 | 0.660677 |
| 9-2 | 87.2 | 0.501397 | 0.762273 |
| 9-2-5 | 101.1 | 0.960821 | 0.982436 |
| 9-2-6 | 84 | 0.534718 | 0.78496 |
| 9-3 | 94.3 | 0.820472 | 0.924796 |
| 9-3-1 | 88.8 | 0.599029 | 0.826765 |
| 9-3-2 | 123.4 | 0.308326 | 0.595441 |
| 10-1 | 254.7 | 7.51e-05 | 0.00137276 |
| 10-1-1 | 155 | 0.0845032 | 0.270732 |
| 10-2 | 110.1 | 0.753768 | 0.902305 |
| 10-2-2 | 71.8 | 0.338153 | 0.622266 |
| 10-3 | 99 | 0.97151 | 0.983185 |
| 11-1 | 109 | 0.757434 | 0.902305 |
| 11-2 | 143 | 0.128226 | 0.359522 |
| 11-3 | 119.3 | 0.565123 | 0.808797 |
| 11-4 | 135.1 | 0.222276 | 0.496064 |
| 11-4-1 | 123.3 | 0.374677 | 0.653951 |
| 12-1 | 96.6 | 0.896149 | 0.956276 |
| 12-1-1 | 112.5 | 0.686472 | 0.867922 |
| 12-2 | 277.5 | 2.34e-06 | 9.68e-05 |
| 12-3 | 164.3 | 0.0229859 | 0.114348 |
| 12-3-1 | 111.3 | 0.664999 | 0.860843 |
| 12-4 | 80.2 | 0.398797 | 0.675098 |
| 12-4-1 | 81.1 | 0.410058 | 0.680927 |
* Note
- A value of zero means the 1-pentanol concentration wasbelow the level of dection
- No measure of 1-pentanol was performed on lines notshown in the figure and table
|
|


