 |
 |
 |
 |
 |
 |
 |
 |
 |
 |
 |
 |
| Relative 1-penten-3-ol level (percent of control)* Experiment: flavor related metabolite profiling in S. pennellii IL lines (FL, Fall 2002, Greenhouse) |
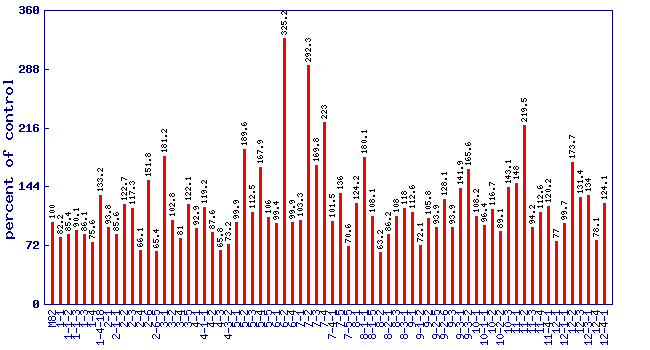 |
| line | relative level (percent of control) |
|---|---|
| M82 | 100 |
| 1-1 | 82.2 |
| 1-1-2 | 85.4 |
| 1-1-3 | 90.1 |
| 1-3 | 86.1 |
| 1-4 | 75.6 |
| 1-4-18 | 133.2 |
| 2-1 | 93.8 |
| 2-1-1 | 85.6 |
| 2-2 | 122.7 |
| 2-3 | 117.3 |
| 2-4 | 66.1 |
| 2-6 | 151.8 |
| 2-6-5 | 65.4 |
| 3-1 | 181.2 |
| 3-2 | 102.8 |
| 3-4 | 81 |
| 3-5 | 122.1 |
| 4-1 | 92.9 |
| 4-1-1 | 119.2 |
| 4-2 | 87.6 |
| 4-3 | 65.8 |
| 4-3-2 | 73.2 |
| 5-1 | 99.9 |
| 5-2 | 189.6 |
| 5-3 | 112.5 |
| 5-4 | 167.9 |
| 5-5 | 106 |
| 6-1 | 99.4 |
| 6-2 | 325.2 |
| 6-4 | 99.9 |
| 7-1 | 103.3 |
| 7-2 | 292.3 |
| 7-3 | 169.8 |
| 7-4 | 223 |
| 7-4-1 | 101.5 |
| 7-5 | 136 |
| 7-5-5 | 70.6 |
| 8-1 | 124.2 |
| 8-1-1 | 180.1 |
| 8-1-5 | 108.1 |
| 8-2 | 63.2 |
| 8-2-1 | 86.2 |
| 8-3 | 108 |
| 8-3-1 | 118 |
| 9-1 | 112.6 |
| 9-1-2 | 72.1 |
| 9-2 | 105.8 |
| 9-2-5 | 93.9 |
| 9-2-6 | 128.1 |
| 9-3 | 93.9 |
| 9-3-1 | 141.9 |
| 9-3-2 | 165.6 |
| 10-1 | 108.2 |
| 10-1-1 | 96.4 |
| 10-2 | 116.7 |
| 10-2-2 | 89.1 |
| 10-3 | 143.1 |
| 11-1 | 148 |
| 11-2 | 219.5 |
| 11-3 | 94.2 |
| 11-4 | 112.6 |
| 11-4-1 | 120.2 |
| 12-1 | 77 |
| 12-1-1 | 99.7 |
| 12-2 | 173.7 |
| 12-3 | 131.4 |
| 12-3-1 | 134 |
| 12-4 | 78.1 |
| 12-4-1 | 124.1 |
* Note
|