 |
 |
 |
 |
 |
 |
 |
 |
 |
 |
 |
 |
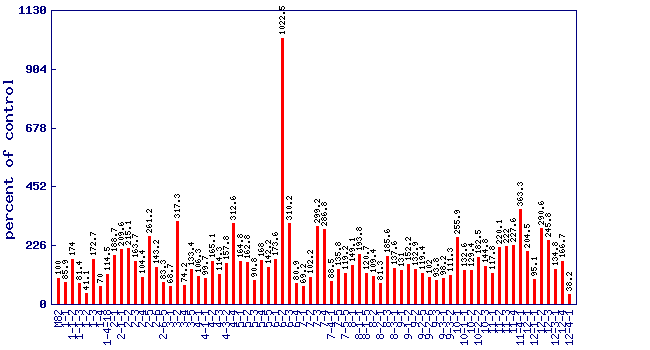
| Relative 1-penten-3-ol level (percent of control)* Experiment: flavor related metabolite profiling in S. pennellii IL lines (FL, Spring 2003, Field) |
 |
| line | relative level (percent of control) |
|---|---|
| M82 | 100 |
| 1-1 | 85.9 |
| 1-1-2 | 174 |
| 1-1-3 | 81.4 |
| 1-2 | 41.1 |
| 1-3 | 172.7 |
| 1-4 | 70 |
| 1-4-18 | 114.5 |
| 2-1 | 188.7 |
| 2-1-1 | 209.6 |
| 2-2 | 215.1 |
| 2-3 | 163.7 |
| 2-4 | 104.4 |
| 2-5 | 261.2 |
| 2-6 | 143.2 |
| 2-6-5 | 83.3 |
| 3-1 | 68.7 |
| 3-2 | 317.3 |
| 3-4 | 74.2 |
| 3-5 | 133.4 |
| 4-1 | 106.3 |
| 4-1-1 | 99.7 |
| 4-2 | 165.1 |
| 4-3 | 114.3 |
| 4-3-2 | 157.8 |
| 4-4 | 312.6 |
| 5-1 | 164.8 |
| 5-2 | 162.8 |
| 5-3 | 90.8 |
| 5-4 | 168 |
| 5-5 | 142.2 |
| 6-1 | 173.6 |
| 6-2 | 1022.5 |
| 6-3 | 310.2 |
| 6-4 | 80.9 |
| 7-1 | 69.2 |
| 7-2 | 102.2 |
| 7-3 | 299.2 |
| 7-4 | 286.8 |
| 7-4-1 | 88.5 |
| 7-5 | 135.8 |
| 7-5-5 | 119.2 |
| 8-1 | 149.1 |
| 8-1-1 | 193.8 |
| 8-1-5 | 120.7 |
| 8-2 | 109.4 |
| 8-2-1 | 81.3 |
| 8-3 | 185.6 |
| 8-3-1 | 137.6 |
| 9-1 | 131 |
| 9-1-2 | 152.2 |
| 9-2 | 132.9 |
| 9-2-5 | 119.4 |
| 9-2-6 | 102 |
| 9-3 | 93.8 |
| 9-3-1 | 98.2 |
| 9-3-2 | 111.3 |
| 10-1 | 255.9 |
| 10-1-1 | 132.6 |
| 10-2 | 129.4 |
| 10-2-2 | 182.5 |
| 10-3 | 144.8 |
| 11-1 | 117.8 |
| 11-2 | 220.1 |
| 11-3 | 222 |
| 11-4 | 227.6 |
| 11-4-1 | 363.3 |
| 12-1 | 204.5 |
| 12-1-1 | 95.1 |
| 12-2 | 290.6 |
| 12-3 | 245.8 |
| 12-3-1 | 134.8 |
| 12-4 | 166.7 |
| 12-4-1 | 38.2 |
* Note
|