 |
 |
 |
 |
 |
 |
 |
 |
 |
 |
 |
 |
| Relative 1-penten-3-ol level (percent of control)* Experiment: flavor related metabolite profiling in S. pennellii IL lines (FL, Spring 2004, Field) |
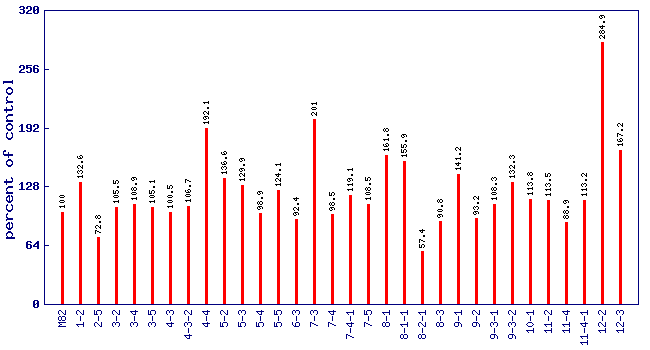 |
| line | relative level (percent of control) |
|---|---|
| M82 | 100 |
| 1-2 | 132.6 |
| 2-5 | 72.8 |
| 3-2 | 105.5 |
| 3-4 | 108.9 |
| 3-5 | 105.1 |
| 4-3 | 100.5 |
| 4-3-2 | 106.7 |
| 4-4 | 192.1 |
| 5-2 | 136.6 |
| 5-3 | 129.9 |
| 5-4 | 98.9 |
| 5-5 | 124.1 |
| 6-3 | 92.4 |
| 7-3 | 201 |
| 7-4 | 98.5 |
| 7-4-1 | 119.1 |
| 7-5 | 108.5 |
| 8-1 | 161.8 |
| 8-1-1 | 155.9 |
| 8-2-1 | 57.4 |
| 8-3 | 90.8 |
| 9-1 | 141.2 |
| 9-2 | 93.2 |
| 9-3-1 | 108.3 |
| 9-3-2 | 132.3 |
| 10-1 | 113.8 |
| 11-2 | 113.5 |
| 11-4 | 88.9 |
| 11-4-1 | 113.2 |
| 12-2 | 284.9 |
| 12-3 | 167.2 |
* Note
|