Relative 1-penten-3-ol level (percent of control)*
Experiment: flavor related metabolite profiling in S. pennellii IL lines (combined)
|
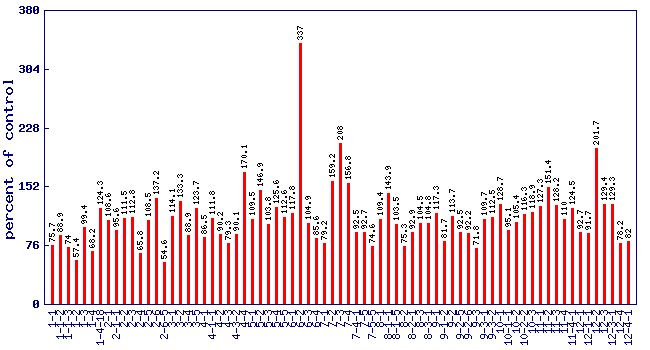 |
| line | relative level (percent of control) | p value | FDR |
|---|
| 1-1 | 75.7 | 0.184773 | 0.443231 |
| 1-1-2 | 88.9 | 0.562359 | 0.807086 |
| 1-1-3 | 74 | 0.126766 | 0.3567 |
| 1-2 | 57.4 | 0.0401233 | 0.162784 |
| 1-3 | 99.4 | 0.978076 | 0.98653 |
| 1-4 | 68.2 | 0.0928886 | 0.289178 |
| 1-4-18 | 124.3 | 0.285068 | 0.572078 |
| 2-1 | 108.6 | 0.744445 | 0.900733 |
| 2-1-1 | 95.6 | 0.809001 | 0.91978 |
| 2-2 | 111.5 | 0.646529 | 0.852958 |
| 2-3 | 112.8 | 0.613623 | 0.832139 |
| 2-4 | 65.8 | 0.119622 | 0.344405 |
| 2-5 | 108.5 | 0.722343 | 0.885382 |
| 2-6 | 137.2 | 0.146975 | 0.387227 |
| 2-6-5 | 54.6 | 0.00776062 | 0.0516936 |
| 3-1 | 114.1 | 0.562206 | 0.807086 |
| 3-2 | 133.3 | 0.126614 | 0.3567 |
| 3-4 | 88.9 | 0.589808 | 0.822459 |
| 3-5 | 123.7 | 0.236356 | 0.513666 |
| 4-1 | 86.5 | 0.473906 | 0.742013 |
| 4-1-1 | 111.8 | 0.623873 | 0.839614 |
| 4-2 | 90.2 | 0.609891 | 0.831285 |
| 4-3 | 79.3 | 0.203563 | 0.471637 |
| 4-3-2 | 90.1 | 0.569006 | 0.810704 |
| 4-4 | 170.1 | 0.0156869 | 0.08724 |
| 5-1 | 109.5 | 0.663888 | 0.860609 |
| 5-2 | 146.9 | 0.0400897 | 0.162784 |
| 5-3 | 103.8 | 0.845614 | 0.93701 |
| 5-4 | 125.6 | 0.33857 | 0.622266 |
| 5-5 | 112.6 | 0.547749 | 0.796562 |
| 6-1 | 117.8 | 0.574263 | 0.812904 |
| 6-2 | 337 | 0.00629115 | 0.0450898 |
| 6-3 | 104.9 | 0.833042 | 0.933165 |
| 6-4 | 85.6 | 0.537002 | 0.786002 |
| 7-1 | 79.2 | 0.266331 | 0.551049 |
| 7-2 | 159.2 | 0.11049 | 0.328543 |
| 7-3 | 208 | 0.000225542 | 0.00322182 |
| 7-4 | 156.8 | 0.0270713 | 0.126436 |
| 7-4-1 | 92.5 | 0.662441 | 0.860387 |
| 7-5 | 92.7 | 0.678964 | 0.867827 |
| 7-5-5 | 74.6 | 0.17882 | 0.434698 |
| 8-1 | 109.4 | 0.642368 | 0.850479 |
| 8-1-1 | 143.9 | 0.0424437 | 0.169058 |
| 8-1-5 | 103.5 | 0.844853 | 0.936608 |
| 8-2 | 75.3 | 0.328864 | 0.613013 |
| 8-2-1 | 92.9 | 0.632033 | 0.844861 |
| 8-3 | 104.5 | 0.825097 | 0.928677 |
| 8-3-1 | 104.8 | 0.81318 | 0.921519 |
| 9-1 | 117.3 | 0.38188 | 0.660677 |
| 9-1-2 | 81.7 | 0.372389 | 0.651842 |
| 9-2 | 113.7 | 0.417655 | 0.688695 |
| 9-2-5 | 92.5 | 0.662129 | 0.860387 |
| 9-2-6 | 92.2 | 0.709043 | 0.877095 |
| 9-3 | 71.8 | 0.103404 | 0.312998 |
| 9-3-1 | 109.7 | 0.59811 | 0.826695 |
| 9-3-2 | 112.5 | 0.46151 | 0.729873 |
| 10-1 | 128.7 | 0.167964 | 0.417785 |
| 10-1-1 | 95.1 | 0.800849 | 0.918627 |
| 10-2 | 105.4 | 0.824161 | 0.92851 |
| 10-2-2 | 116.3 | 0.574953 | 0.812904 |
| 10-3 | 118.9 | 0.445761 | 0.714238 |
| 11-1 | 127.3 | 0.268142 | 0.553659 |
| 11-2 | 151.4 | 0.02358 | 0.116079 |
| 11-3 | 128.2 | 0.296598 | 0.583202 |
| 11-4 | 110 | 0.619641 | 0.837072 |
| 11-4-1 | 124.5 | 0.231398 | 0.507098 |
| 12-1 | 92.7 | 0.709998 | 0.877095 |
| 12-1-1 | 91.7 | 0.703322 | 0.876551 |
| 12-2 | 201.7 | 2.93e-05 | 0.000633848 |
| 12-3 | 129.4 | 0.129365 | 0.360569 |
| 12-3-1 | 129.3 | 0.181916 | 0.439507 |
| 12-4 | 78.2 | 0.22687 | 0.501838 |
| 12-4-1 | 82 | 0.313494 | 0.599043 |
* Note
- A value of zero means the 1-penten-3-ol concentration wasbelow the level of dection
- No measure of 1-penten-3-ol was performed on lines notshown in the figure and table
|
|


