 |
 |
 |
 |
 |
 |
 |
 |
 |
 |
 |
 |
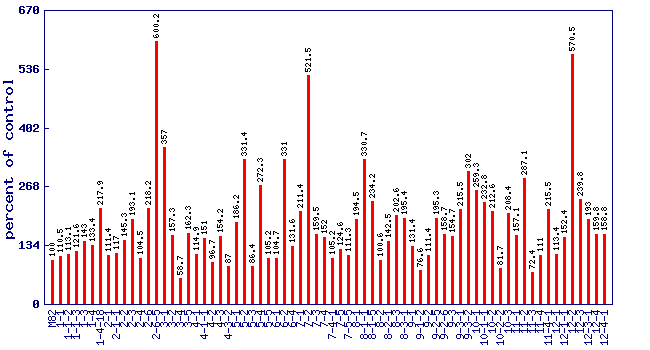
| Relative 1-penten-3-one level (percent of control)* Experiment: flavor related metabolite profiling in S. pennellii IL lines (FL, Fall 2002, Greenhouse) |
 |
| line | relative level (percent of control) |
|---|---|
| M82 | 100 |
| 1-1 | 110.5 |
| 1-1-2 | 113.1 |
| 1-1-3 | 121.6 |
| 1-3 | 143 |
| 1-4 | 133.4 |
| 1-4-18 | 217.9 |
| 2-1 | 111.4 |
| 2-1-1 | 117 |
| 2-2 | 145.3 |
| 2-3 | 193.1 |
| 2-4 | 104.5 |
| 2-6 | 218.2 |
| 2-6-5 | 600.2 |
| 3-1 | 357 |
| 3-2 | 157.3 |
| 3-4 | 58.7 |
| 3-5 | 162.3 |
| 4-1 | 114.9 |
| 4-1-1 | 151 |
| 4-2 | 96.7 |
| 4-3 | 154.2 |
| 4-3-2 | 87 |
| 5-1 | 186.2 |
| 5-2 | 331.4 |
| 5-3 | 86.4 |
| 5-4 | 272.3 |
| 5-5 | 105.2 |
| 6-1 | 104.7 |
| 6-2 | 331 |
| 6-4 | 131.6 |
| 7-1 | 211.4 |
| 7-2 | 521.5 |
| 7-3 | 159.5 |
| 7-4 | 152 |
| 7-4-1 | 105.2 |
| 7-5 | 124.6 |
| 7-5-5 | 111.3 |
| 8-1 | 194.5 |
| 8-1-1 | 330.7 |
| 8-1-5 | 234.2 |
| 8-2 | 100.6 |
| 8-2-1 | 142.5 |
| 8-3 | 202.6 |
| 8-3-1 | 195.4 |
| 9-1 | 131.4 |
| 9-1-2 | 76.6 |
| 9-2 | 111.4 |
| 9-2-5 | 195.3 |
| 9-2-6 | 158.7 |
| 9-3 | 154.7 |
| 9-3-1 | 215.5 |
| 9-3-2 | 302 |
| 10-1 | 259.3 |
| 10-1-1 | 232.8 |
| 10-2 | 212.6 |
| 10-2-2 | 81.7 |
| 10-3 | 208.4 |
| 11-1 | 157.1 |
| 11-2 | 287.1 |
| 11-3 | 72.4 |
| 11-4 | 111 |
| 11-4-1 | 215.5 |
| 12-1 | 113.4 |
| 12-1-1 | 152.4 |
| 12-2 | 570.5 |
| 12-3 | 239.8 |
| 12-3-1 | 193 |
| 12-4 | 159.8 |
| 12-4-1 | 158.8 |
* Note
|