 |
 |
 |
 |
 |
 |
 |
 |
 |
 |
 |
 |
| Relative 1-penten-3-one level (percent of control)* Experiment: flavor related metabolite profiling in S. pennellii IL lines (FL, Spring 2003, Field) |
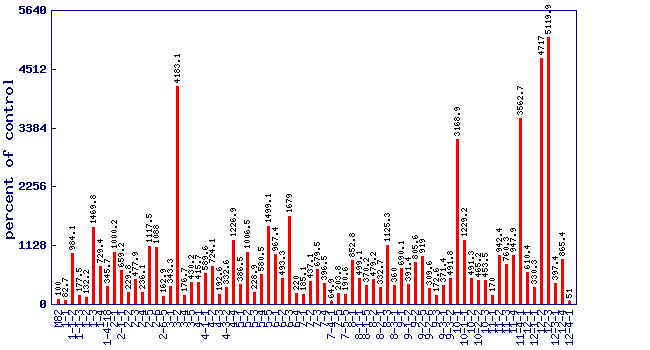 |
| line | relative level (percent of control) |
|---|---|
| M82 | 100 |
| 1-1 | 82.7 |
| 1-1-2 | 984.1 |
| 1-1-3 | 177.5 |
| 1-2 | 132.2 |
| 1-3 | 1469.8 |
| 1-4 | 729.4 |
| 1-4-18 | 345.7 |
| 2-1 | 1000.2 |
| 2-1-1 | 659.2 |
| 2-2 | 229.8 |
| 2-3 | 477.9 |
| 2-4 | 236.1 |
| 2-5 | 1117.5 |
| 2-6 | 1088 |
| 2-6-5 | 162.9 |
| 3-1 | 343.3 |
| 3-2 | 4183.1 |
| 3-4 | 176.7 |
| 3-5 | 430.2 |
| 4-1 | 415.7 |
| 4-1-1 | 589.6 |
| 4-2 | 724.1 |
| 4-3 | 192.6 |
| 4-3-2 | 332.6 |
| 4-4 | 1226.9 |
| 5-1 | 386.5 |
| 5-2 | 1006.5 |
| 5-3 | 228.9 |
| 5-4 | 580.5 |
| 5-5 | 1499.1 |
| 6-1 | 967.4 |
| 6-2 | 493.3 |
| 6-3 | 1679 |
| 6-4 | 220 |
| 7-1 | 185.1 |
| 7-2 | 437.1 |
| 7-3 | 679.5 |
| 7-4 | 396.5 |
| 7-4-1 | 64.9 |
| 7-5 | 203.8 |
| 7-5-5 | 190.6 |
| 8-1 | 852.8 |
| 8-1-1 | 499.1 |
| 8-1-5 | 370.2 |
| 8-2 | 479.2 |
| 8-2-1 | 332.7 |
| 8-3 | 1125.3 |
| 8-3-1 | 360 |
| 9-1 | 690.1 |
| 9-1-2 | 391.4 |
| 9-2 | 805.6 |
| 9-2-5 | 919 |
| 9-2-6 | 309.6 |
| 9-3 | 172.6 |
| 9-3-1 | 371.4 |
| 9-3-2 | 491.8 |
| 10-1 | 3168.9 |
| 10-1-1 | 1229.2 |
| 10-2 | 491.3 |
| 10-2-2 | 465.2 |
| 10-3 | 453.5 |
| 11-1 | 170 |
| 11-2 | 942.4 |
| 11-3 | 760.3 |
| 11-4 | 947.9 |
| 11-4-1 | 3562.7 |
| 12-1 | 610.4 |
| 12-1-1 | 330.3 |
| 12-2 | 4717 |
| 12-3 | 5119.9 |
| 12-3-1 | 397.4 |
| 12-4 | 865.4 |
| 12-4-1 | 51 |
* Note
|