 |
 |
 |
 |
 |
 |
 |
 |
 |
 |
 |
 |
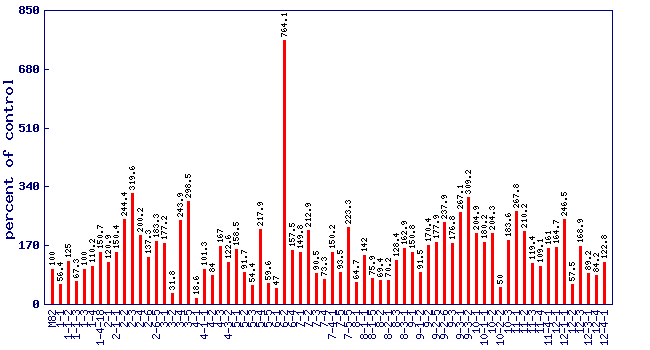
| Relative 2-isobutylthiazole level (percent of control)* Experiment: flavor related metabolite profiling in S. pennellii IL lines (FL, Fall 2002, Greenhouse) |
 |
| line | relative level (percent of control) |
|---|---|
| M82 | 100 |
| 1-1 | 56.4 |
| 1-1-2 | 125 |
| 1-1-3 | 67.3 |
| 1-3 | 100 |
| 1-4 | 110.2 |
| 1-4-18 | 150.7 |
| 2-1 | 120.9 |
| 2-1-1 | 150.4 |
| 2-2 | 244.4 |
| 2-3 | 319.6 |
| 2-4 | 200.2 |
| 2-6 | 137.3 |
| 2-6-5 | 183.3 |
| 3-1 | 177.2 |
| 3-2 | 31.8 |
| 3-4 | 243.9 |
| 3-5 | 298.5 |
| 4-1 | 18.6 |
| 4-1-1 | 101.3 |
| 4-2 | 84 |
| 4-3 | 167 |
| 4-3-2 | 122.6 |
| 5-1 | 158.5 |
| 5-2 | 91.7 |
| 5-3 | 54.4 |
| 5-4 | 217.9 |
| 5-5 | 59.6 |
| 6-1 | 47 |
| 6-2 | 764.1 |
| 6-4 | 157.5 |
| 7-1 | 149.8 |
| 7-2 | 212.9 |
| 7-3 | 90.5 |
| 7-4 | 73.3 |
| 7-4-1 | 150.2 |
| 7-5 | 93.5 |
| 7-5-5 | 223.3 |
| 8-1 | 64.7 |
| 8-1-1 | 142 |
| 8-1-5 | 75.9 |
| 8-2 | 69.4 |
| 8-2-1 | 70.2 |
| 8-3 | 128.4 |
| 8-3-1 | 162.9 |
| 9-1 | 150.8 |
| 9-1-2 | 91.5 |
| 9-2 | 170.4 |
| 9-2-5 | 177.9 |
| 9-2-6 | 237.9 |
| 9-3 | 176.8 |
| 9-3-1 | 267.1 |
| 9-3-2 | 309.2 |
| 10-1 | 204.9 |
| 10-1-1 | 180.2 |
| 10-2 | 204.3 |
| 10-2-2 | 50 |
| 10-3 | 183.6 |
| 11-1 | 267.8 |
| 11-2 | 210.2 |
| 11-3 | 119.4 |
| 11-4 | 109.1 |
| 11-4-1 | 161 |
| 12-1 | 164.7 |
| 12-1-1 | 246.5 |
| 12-2 | 57.5 |
| 12-3 | 168.9 |
| 12-3-1 | 89.2 |
| 12-4 | 84.2 |
| 12-4-1 | 122.8 |
* Note
|