 |
 |
 |
 |
 |
 |
 |
 |
 |
 |
 |
 |
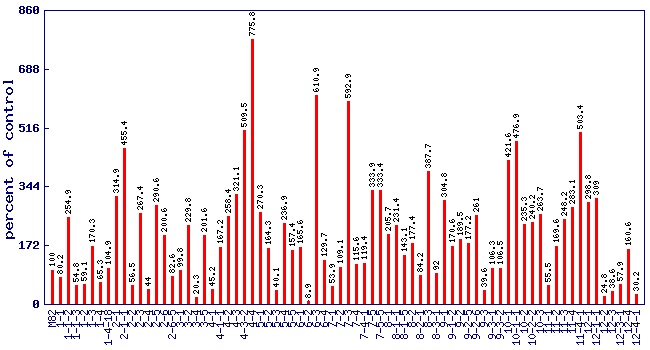
| Relative 2-isobutylthiazole level (percent of control)* Experiment: flavor related metabolite profiling in S. pennellii IL lines (FL, Spring 2003, Field) |
 |
| line | relative level (percent of control) |
|---|---|
| M82 | 100 |
| 1-1 | 80.2 |
| 1-1-2 | 254.9 |
| 1-1-3 | 54.8 |
| 1-2 | 59.1 |
| 1-3 | 170.3 |
| 1-4 | 65.3 |
| 1-4-18 | 104.9 |
| 2-1 | 314.9 |
| 2-1-1 | 455.4 |
| 2-2 | 56.5 |
| 2-3 | 267.4 |
| 2-4 | 44 |
| 2-5 | 290.6 |
| 2-6 | 200.6 |
| 2-6-5 | 82.6 |
| 3-1 | 99.8 |
| 3-2 | 229.8 |
| 3-4 | 20.3 |
| 3-5 | 201.6 |
| 4-1 | 45.2 |
| 4-1-1 | 167.2 |
| 4-2 | 258.4 |
| 4-3 | 321.1 |
| 4-3-2 | 509.5 |
| 4-4 | 775.8 |
| 5-1 | 270.3 |
| 5-2 | 164.3 |
| 5-3 | 40.1 |
| 5-4 | 236.9 |
| 5-5 | 157.4 |
| 6-1 | 165.6 |
| 6-2 | 8.9 |
| 6-3 | 610.9 |
| 6-4 | 129.7 |
| 7-1 | 53.9 |
| 7-2 | 109.1 |
| 7-3 | 592.9 |
| 7-4 | 115.6 |
| 7-4-1 | 119.4 |
| 7-5 | 333.9 |
| 7-5-5 | 333.4 |
| 8-1 | 205.7 |
| 8-1-1 | 231.4 |
| 8-1-5 | 143.1 |
| 8-2 | 177.4 |
| 8-2-1 | 84.2 |
| 8-3 | 387.7 |
| 8-3-1 | 92 |
| 9-1 | 304.8 |
| 9-1-2 | 170.6 |
| 9-2 | 189.5 |
| 9-2-5 | 177.2 |
| 9-2-6 | 261 |
| 9-3 | 39.6 |
| 9-3-1 | 106.3 |
| 9-3-2 | 106.5 |
| 10-1 | 421.6 |
| 10-1-1 | 476.9 |
| 10-2 | 235.3 |
| 10-2-2 | 240.2 |
| 10-3 | 263.7 |
| 11-1 | 55.5 |
| 11-2 | 169.6 |
| 11-3 | 248.2 |
| 11-4 | 283.1 |
| 11-4-1 | 503.4 |
| 12-1 | 298.8 |
| 12-1-1 | 309 |
| 12-2 | 24.8 |
| 12-3 | 38.6 |
| 12-3-1 | 57.9 |
| 12-4 | 160.6 |
| 12-4-1 | 30.2 |
* Note
|