 |
 |
 |
 |
 |
 |
 |
 |
 |
 |
 |
 |
| Relative 2-isobutylthiazole level (percent of control)* Experiment: flavor related metabolite profiling in S. pennellii IL lines (FL, Fall 2003, Field) |
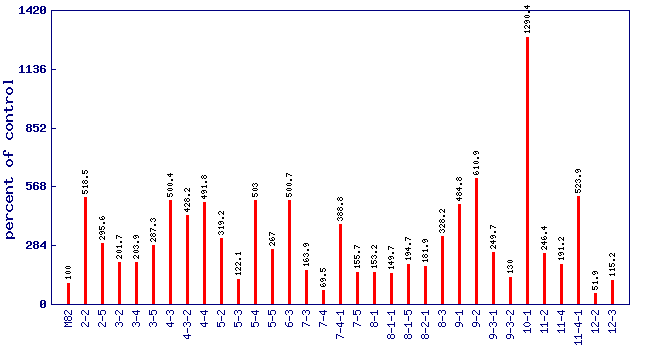 |
| line | relative level (percent of control) |
|---|---|
| M82 | 100 |
| 2-2 | 518.5 |
| 2-5 | 295.6 |
| 3-2 | 201.7 |
| 3-4 | 203.9 |
| 3-5 | 287.3 |
| 4-3 | 500.4 |
| 4-3-2 | 428.2 |
| 4-4 | 491.8 |
| 5-2 | 319.2 |
| 5-3 | 122.1 |
| 5-4 | 503 |
| 5-5 | 267 |
| 6-3 | 500.7 |
| 7-3 | 163.9 |
| 7-4 | 69.5 |
| 7-4-1 | 388.8 |
| 7-5 | 155.7 |
| 8-1 | 153.2 |
| 8-1-1 | 149.7 |
| 8-1-5 | 194.7 |
| 8-2-1 | 181.9 |
| 8-3 | 328.2 |
| 9-1 | 484.8 |
| 9-2 | 610.9 |
| 9-3-1 | 249.7 |
| 9-3-2 | 130 |
| 10-1 | 1290.4 |
| 11-2 | 246.4 |
| 11-4 | 191.2 |
| 11-4-1 | 523.9 |
| 12-2 | 51.9 |
| 12-3 | 115.2 |
* Note
|