 |
 |
 |
 |
 |
 |
 |
 |
 |
 |
 |
 |
| Relative 2-isobutylthiazole level (percent of control)* Experiment: flavor related metabolite profiling in S. pennellii IL lines (FL, Spring 2004, Field) |
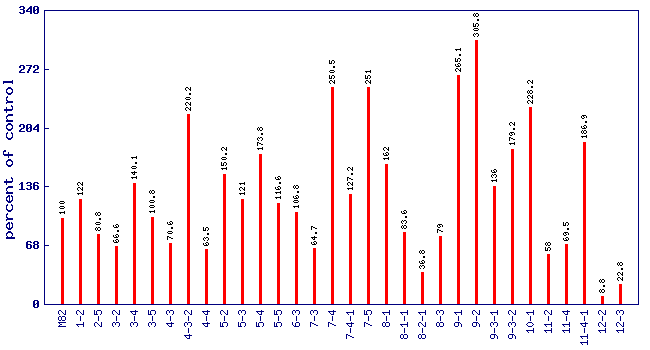 |
| line | relative level (percent of control) |
|---|---|
| M82 | 100 |
| 1-2 | 122 |
| 2-5 | 80.8 |
| 3-2 | 66.6 |
| 3-4 | 140.1 |
| 3-5 | 100.8 |
| 4-3 | 70.6 |
| 4-3-2 | 220.2 |
| 4-4 | 63.5 |
| 5-2 | 150.2 |
| 5-3 | 121 |
| 5-4 | 173.8 |
| 5-5 | 116.6 |
| 6-3 | 106.8 |
| 7-3 | 64.7 |
| 7-4 | 250.5 |
| 7-4-1 | 127.2 |
| 7-5 | 251 |
| 8-1 | 162 |
| 8-1-1 | 83.6 |
| 8-2-1 | 36.8 |
| 8-3 | 79 |
| 9-1 | 265.1 |
| 9-2 | 305.8 |
| 9-3-1 | 136 |
| 9-3-2 | 179.2 |
| 10-1 | 228.2 |
| 11-2 | 58 |
| 11-4 | 69.5 |
| 11-4-1 | 186.9 |
| 12-2 | 8.8 |
| 12-3 | 22.8 |
* Note
|