 |
 |
 |
 |
 |
 |
 |
 |
 |
 |
 |
 |
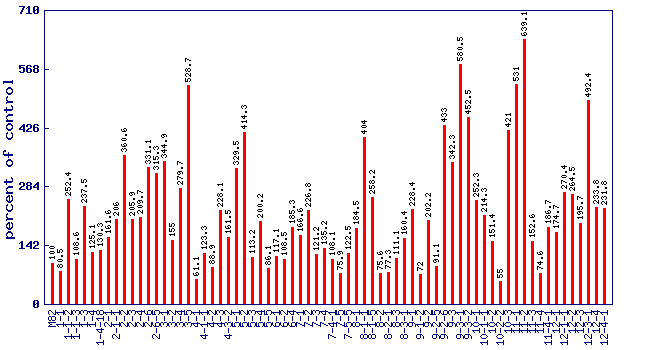
| Relative 2-methylbutanal level (percent of control)* Experiment: flavor related metabolite profiling in S. pennellii IL lines (FL, Fall 2002, Greenhouse) |
 |
| line | relative level (percent of control) |
|---|---|
| M82 | 100 |
| 1-1 | 80.5 |
| 1-1-2 | 252.4 |
| 1-1-3 | 108.6 |
| 1-3 | 237.5 |
| 1-4 | 125.1 |
| 1-4-18 | 130.3 |
| 2-1 | 161.6 |
| 2-1-1 | 206 |
| 2-2 | 360.6 |
| 2-3 | 205.9 |
| 2-4 | 209.7 |
| 2-6 | 331.1 |
| 2-6-5 | 315.3 |
| 3-1 | 344.9 |
| 3-2 | 155 |
| 3-4 | 279.7 |
| 3-5 | 528.7 |
| 4-1 | 61.1 |
| 4-1-1 | 123.3 |
| 4-2 | 88.9 |
| 4-3 | 228.1 |
| 4-3-2 | 161.5 |
| 5-1 | 329.5 |
| 5-2 | 414.3 |
| 5-3 | 113.2 |
| 5-4 | 200.2 |
| 5-5 | 86.1 |
| 6-1 | 117.1 |
| 6-2 | 108.5 |
| 6-4 | 185.3 |
| 7-1 | 166.6 |
| 7-2 | 226.8 |
| 7-3 | 121.2 |
| 7-4 | 135.2 |
| 7-4-1 | 108.1 |
| 7-5 | 75.9 |
| 7-5-5 | 122.5 |
| 8-1 | 184.5 |
| 8-1-1 | 404 |
| 8-1-5 | 258.2 |
| 8-2 | 75.6 |
| 8-2-1 | 77.3 |
| 8-3 | 111.1 |
| 8-3-1 | 160.4 |
| 9-1 | 228.4 |
| 9-1-2 | 72 |
| 9-2 | 202.2 |
| 9-2-5 | 91.1 |
| 9-2-6 | 433 |
| 9-3 | 342.3 |
| 9-3-1 | 580.5 |
| 9-3-2 | 452.5 |
| 10-1 | 252.3 |
| 10-1-1 | 214.3 |
| 10-2 | 151.4 |
| 10-2-2 | 55 |
| 10-3 | 421 |
| 11-1 | 531 |
| 11-2 | 639.1 |
| 11-3 | 152.6 |
| 11-4 | 74.6 |
| 11-4-1 | 186.7 |
| 12-1 | 174.7 |
| 12-1-1 | 270.4 |
| 12-2 | 264.5 |
| 12-3 | 195.7 |
| 12-3-1 | 492.4 |
| 12-4 | 233.8 |
| 12-4-1 | 231.8 |
* Note
|