 |
 |
 |
 |
 |
 |
 |
 |
 |
 |
 |
 |
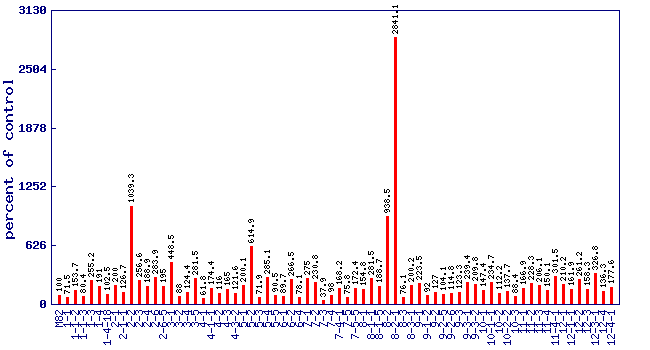
| Relative 2-phenylethanol level (percent of control)* Experiment: flavor related metabolite profiling in S. pennellii IL lines (FL, Fall 2002, Greenhouse) |
 |
| line | relative level (percent of control) |
|---|---|
| M82 | 100 |
| 1-1 | 71.5 |
| 1-1-2 | 153.7 |
| 1-1-3 | 80.4 |
| 1-3 | 255.2 |
| 1-4 | 191 |
| 1-4-18 | 102.5 |
| 2-1 | 200 |
| 2-1-1 | 126.7 |
| 2-2 | 1039.3 |
| 2-3 | 256.6 |
| 2-4 | 188.9 |
| 2-6 | 283.9 |
| 2-6-5 | 195 |
| 3-1 | 448.5 |
| 3-2 | 88 |
| 3-4 | 124.4 |
| 3-5 | 281.5 |
| 4-1 | 61.8 |
| 4-1-1 | 174.4 |
| 4-2 | 116 |
| 4-3 | 165 |
| 4-3-2 | 121.6 |
| 5-1 | 200.1 |
| 5-2 | 614.9 |
| 5-3 | 71.9 |
| 5-4 | 285.1 |
| 5-5 | 90.5 |
| 6-1 | 89.7 |
| 6-2 | 266.5 |
| 6-4 | 78.1 |
| 7-1 | 275 |
| 7-2 | 230.8 |
| 7-3 | 37.9 |
| 7-4 | 98 |
| 7-4-1 | 168.2 |
| 7-5 | 75.8 |
| 7-5-5 | 172.4 |
| 8-1 | 154.8 |
| 8-1-1 | 281.5 |
| 8-1-5 | 188.7 |
| 8-2 | 938.5 |
| 8-2-1 | 2841.1 |
| 8-3 | 76.1 |
| 8-3-1 | 200.2 |
| 9-1 | 223.5 |
| 9-1-2 | 92 |
| 9-2 | 127 |
| 9-2-5 | 104.1 |
| 9-2-6 | 114.8 |
| 9-3 | 123.3 |
| 9-3-1 | 239.4 |
| 9-3-2 | 209.8 |
| 10-1 | 147.4 |
| 10-1-1 | 234.7 |
| 10-2 | 112.2 |
| 10-2-2 | 137.7 |
| 10-3 | 88.4 |
| 11-1 | 166.9 |
| 11-2 | 228.3 |
| 11-3 | 206.1 |
| 11-4 | 150.1 |
| 11-4-1 | 301.5 |
| 12-1 | 210.2 |
| 12-1-1 | 161.9 |
| 12-2 | 261.2 |
| 12-3 | 158.3 |
| 12-3-1 | 326.8 |
| 12-4 | 136.3 |
| 12-4-1 | 177.6 |
* Note
|