 |
 |
 |
 |
 |
 |
 |
 |
 |
 |
 |
 |
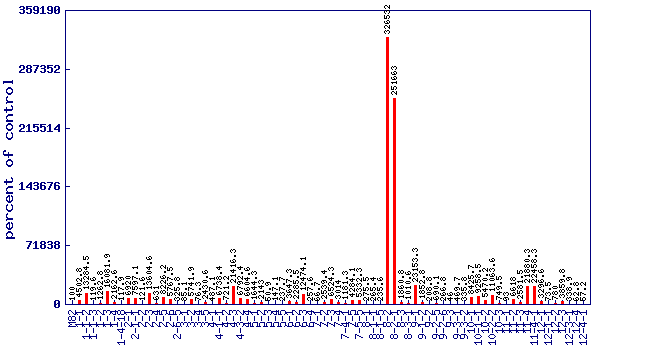
| Relative 2-phenylethanol level (percent of control)* Experiment: flavor related metabolite profiling in S. pennellii IL lines (FL, Spring 2003, Field) |
 |
| line | relative level (percent of control) |
|---|---|
| M82 | 100 |
| 1-1 | 4502.8 |
| 1-1-2 | 13284.5 |
| 1-1-3 | 119.6 |
| 1-2 | 1262.8 |
| 1-3 | 16081.9 |
| 1-4 | 2162.6 |
| 1-4-18 | 117.9 |
| 2-1 | 6920 |
| 2-1-1 | 7597.1 |
| 2-2 | 121.6 |
| 2-3 | 13604.6 |
| 2-4 | 631 |
| 2-5 | 8226.2 |
| 2-6 | 5767.5 |
| 2-6-5 | 325.8 |
| 3-1 | 85.1 |
| 3-2 | 5741.9 |
| 3-4 | 76.3 |
| 3-5 | 2430.6 |
| 4-1 | 487.1 |
| 4-1-1 | 6738.4 |
| 4-2 | 721.2 |
| 4-3 | 21416.3 |
| 4-3-2 | 6792.4 |
| 4-4 | 6604.6 |
| 5-1 | 1644.3 |
| 5-2 | 2143 |
| 5-3 | 50.9 |
| 5-4 | 147.1 |
| 5-5 | 237.7 |
| 6-1 | 3647.3 |
| 6-2 | 2285.5 |
| 6-3 | 12474.1 |
| 6-4 | 257.6 |
| 7-1 | 66.7 |
| 7-2 | 2539.4 |
| 7-3 | 6524.3 |
| 7-4 | 3014 |
| 7-4-1 | 1181.3 |
| 7-5 | 4284.1 |
| 7-5-5 | 5332.3 |
| 8-1 | 275.5 |
| 8-1-1 | 265.4 |
| 8-1-5 | 235.6 |
| 8-2 | 326532 |
| 8-2-1 | 251663 |
| 8-3 | 1860.8 |
| 8-3-1 | 1010.6 |
| 9-1 | 23153.3 |
| 9-1-2 | 1852.8 |
| 9-2 | 208.8 |
| 9-2-5 | 690.1 |
| 9-2-6 | 266.8 |
| 9-3 | 46 |
| 9-3-1 | 469.7 |
| 9-3-2 | 335.8 |
| 10-1 | 8425.7 |
| 10-1-1 | 9258.5 |
| 10-2 | 5470.2 |
| 10-2-2 | 11063.6 |
| 10-3 | 749.5 |
| 11-1 | 93 |
| 11-2 | 6618 |
| 11-3 | 2581.5 |
| 11-4 | 21880.3 |
| 11-4-1 | 22458.3 |
| 12-1 | 3296.6 |
| 12-1-1 | 73.5 |
| 12-2 | 780 |
| 12-3 | 3859.8 |
| 12-3-1 | 338.9 |
| 12-4 | 62.8 |
| 12-4-1 | 57.2 |
* Note
|