 |
 |
 |
 |
 |
 |
 |
 |
 |
 |
 |
 |
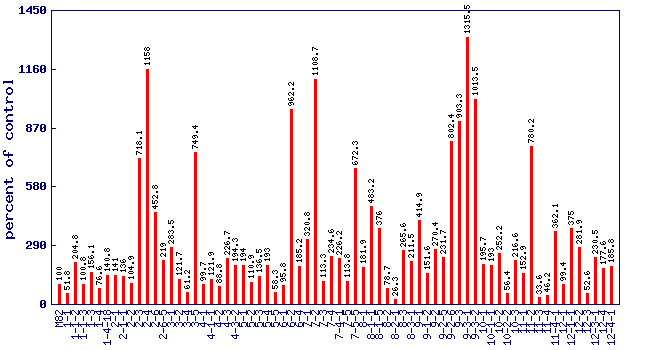
| Relative 3-methyl-1-butanol level (percent of control)* Experiment: flavor related metabolite profiling in S. pennellii IL lines (FL, Fall 2002, Greenhouse) |
 |
| line | relative level (percent of control) |
|---|---|
| M82 | 100 |
| 1-1 | 51.8 |
| 1-1-2 | 204.8 |
| 1-1-3 | 100.8 |
| 1-3 | 156.1 |
| 1-4 | 76.6 |
| 1-4-18 | 140.8 |
| 2-1 | 141 |
| 2-1-1 | 136 |
| 2-2 | 104.9 |
| 2-3 | 718.1 |
| 2-4 | 1158 |
| 2-6 | 452.8 |
| 2-6-5 | 219 |
| 3-1 | 283.5 |
| 3-2 | 121.7 |
| 3-4 | 61.2 |
| 3-5 | 749.4 |
| 4-1 | 99.7 |
| 4-1-1 | 121.9 |
| 4-2 | 88.8 |
| 4-3 | 226.7 |
| 4-3-2 | 194.3 |
| 5-1 | 194 |
| 5-2 | 110.9 |
| 5-3 | 136.5 |
| 5-4 | 193 |
| 5-5 | 58.3 |
| 6-1 | 95.8 |
| 6-2 | 962.2 |
| 6-4 | 185.2 |
| 7-1 | 320.8 |
| 7-2 | 1108.7 |
| 7-3 | 113.3 |
| 7-4 | 234.6 |
| 7-4-1 | 226.2 |
| 7-5 | 113.8 |
| 7-5-5 | 672.3 |
| 8-1 | 181.9 |
| 8-1-1 | 483.2 |
| 8-1-5 | 376 |
| 8-2 | 78.7 |
| 8-2-1 | 26.3 |
| 8-3 | 265.6 |
| 8-3-1 | 211.5 |
| 9-1 | 414.9 |
| 9-1-2 | 151.6 |
| 9-2 | 270.4 |
| 9-2-5 | 231.7 |
| 9-2-6 | 802.4 |
| 9-3 | 903.3 |
| 9-3-1 | 1315.5 |
| 9-3-2 | 1013.5 |
| 10-1 | 195.7 |
| 10-1-1 | 193 |
| 10-2 | 252.2 |
| 10-2-2 | 56.4 |
| 10-3 | 216.6 |
| 11-1 | 152.9 |
| 11-2 | 780.2 |
| 11-3 | 33.6 |
| 11-4 | 46.2 |
| 11-4-1 | 362.1 |
| 12-1 | 99.4 |
| 12-1-1 | 375 |
| 12-2 | 281.9 |
| 12-3 | 52.6 |
| 12-3-1 | 230.5 |
| 12-4 | 177.6 |
| 12-4-1 | 185.8 |
* Note
|