 |
 |
 |
 |
 |
 |
 |
 |
 |
 |
 |
 |
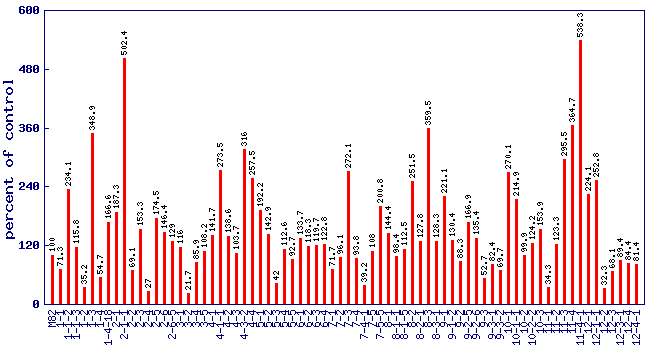
| Relative 6-methyl-5-hepten-2-one level (percent of control)* Experiment: flavor related metabolite profiling in S. pennellii IL lines (FL, Spring 2003, Field) |
 |
| line | relative level (percent of control) |
|---|---|
| M82 | 100 |
| 1-1 | 71.3 |
| 1-1-2 | 234.1 |
| 1-1-3 | 115.8 |
| 1-2 | 35.2 |
| 1-3 | 348.9 |
| 1-4 | 54.7 |
| 1-4-18 | 166.6 |
| 2-1 | 187.3 |
| 2-1-1 | 502.4 |
| 2-2 | 69.1 |
| 2-3 | 153.3 |
| 2-4 | 27 |
| 2-5 | 174.5 |
| 2-6 | 146.4 |
| 2-6-5 | 129 |
| 3-1 | 116 |
| 3-2 | 21.7 |
| 3-4 | 85.9 |
| 3-5 | 108.2 |
| 4-1 | 141.7 |
| 4-1-1 | 273.5 |
| 4-2 | 138.6 |
| 4-3 | 103.7 |
| 4-3-2 | 316 |
| 4-4 | 257.5 |
| 5-1 | 192.2 |
| 5-2 | 142.9 |
| 5-3 | 42 |
| 5-4 | 112.6 |
| 5-5 | 92.7 |
| 6-1 | 133.7 |
| 6-2 | 118.3 |
| 6-3 | 119.7 |
| 6-4 | 122.8 |
| 7-1 | 71.7 |
| 7-2 | 96.1 |
| 7-3 | 272.1 |
| 7-4 | 93.8 |
| 7-4-1 | 39.2 |
| 7-5 | 108 |
| 7-5-5 | 200.8 |
| 8-1 | 144.4 |
| 8-1-1 | 98.4 |
| 8-1-5 | 112.5 |
| 8-2 | 251.5 |
| 8-2-1 | 127.8 |
| 8-3 | 359.5 |
| 8-3-1 | 128.3 |
| 9-1 | 221.1 |
| 9-1-2 | 130.4 |
| 9-2 | 88.3 |
| 9-2-5 | 166.9 |
| 9-2-6 | 135.4 |
| 9-3 | 52.7 |
| 9-3-1 | 82.4 |
| 9-3-2 | 69.7 |
| 10-1 | 270.1 |
| 10-1-1 | 214.9 |
| 10-2 | 99.9 |
| 10-2-2 | 124.2 |
| 10-3 | 153.9 |
| 11-1 | 34.3 |
| 11-2 | 123.3 |
| 11-3 | 295.5 |
| 11-4 | 364.7 |
| 11-4-1 | 538.3 |
| 12-1 | 224.1 |
| 12-1-1 | 252.8 |
| 12-2 | 32.3 |
| 12-3 | 68.1 |
| 12-3-1 | 89.4 |
| 12-4 | 84.4 |
| 12-4-1 | 81.4 |
* Note
|