 |
 |
 |
 |
 |
 |
 |
 |
 |
 |
 |
 |
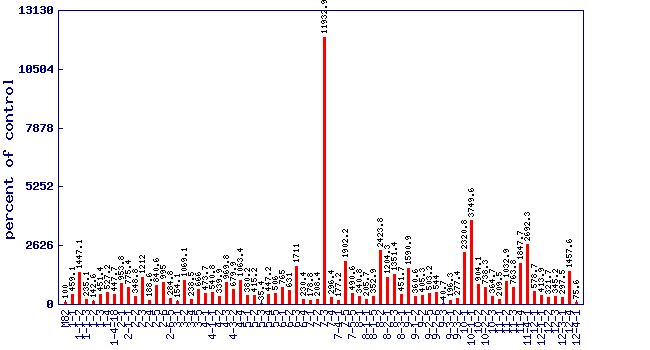
| Relative benzyl alcohol level (percent of control)* Experiment: flavor related metabolite profiling in S. pennellii IL lines (FL, Spring 2003, Field) |
 |
| line | relative level (percent of control) |
|---|---|
| M82 | 100 |
| 1-1 | 459.1 |
| 1-1-2 | 1447.1 |
| 1-1-3 | 235.1 |
| 1-2 | 142.6 |
| 1-3 | 451.4 |
| 1-4 | 527.2 |
| 1-4-18 | 447.7 |
| 2-1 | 953.8 |
| 2-1-1 | 775.4 |
| 2-2 | 348.8 |
| 2-3 | 1212 |
| 2-4 | 188.6 |
| 2-5 | 840.6 |
| 2-6 | 995 |
| 2-6-5 | 284.8 |
| 3-1 | 154.1 |
| 3-2 | 1069.1 |
| 3-4 | 238.5 |
| 3-5 | 666 |
| 4-1 | 473.7 |
| 4-1-1 | 540.8 |
| 4-2 | 339.9 |
| 4-3 | 969.8 |
| 4-3-2 | 679.9 |
| 4-4 | 1063.4 |
| 5-1 | 380.2 |
| 5-2 | 415.2 |
| 5-3 | 35.4 |
| 5-4 | 447.2 |
| 5-5 | 506 |
| 6-1 | 765 |
| 6-2 | 631 |
| 6-3 | 1711 |
| 6-4 | 230.4 |
| 7-1 | 178.8 |
| 7-2 | 208.4 |
| 7-3 | 11932.9 |
| 7-4 | 296.4 |
| 7-4-1 | 177.2 |
| 7-5 | 1902.2 |
| 7-5-5 | 490.6 |
| 8-1 | 340.8 |
| 8-1-1 | 205.7 |
| 8-1-5 | 352.9 |
| 8-2 | 2423.8 |
| 8-2-1 | 1204.3 |
| 8-3 | 1351.4 |
| 8-3-1 | 451.7 |
| 9-1 | 1590.9 |
| 9-1-2 | 360.6 |
| 9-2 | 405.3 |
| 9-2-5 | 503.2 |
| 9-2-6 | 544 |
| 9-3 | 40.7 |
| 9-3-1 | 196.3 |
| 9-3-2 | 277.4 |
| 10-1 | 2320.8 |
| 10-1-1 | 3749.6 |
| 10-2 | 904.1 |
| 10-2-2 | 738.3 |
| 10-3 | 364.7 |
| 11-1 | 209.5 |
| 11-2 | 1032.9 |
| 11-3 | 763.8 |
| 11-4 | 1847.7 |
| 11-4-1 | 2692.3 |
| 12-1 | 578.7 |
| 12-1-1 | 413.9 |
| 12-2 | 321.7 |
| 12-3 | 345.2 |
| 12-3-1 | 297.5 |
| 12-4 | 1457.6 |
| 12-4-1 | 75.6 |
* Note
|