Relative beta damascenone level (percent of control)*
Experiment: flavor related metabolite profiling in S. pennellii IL lines (combined)
|
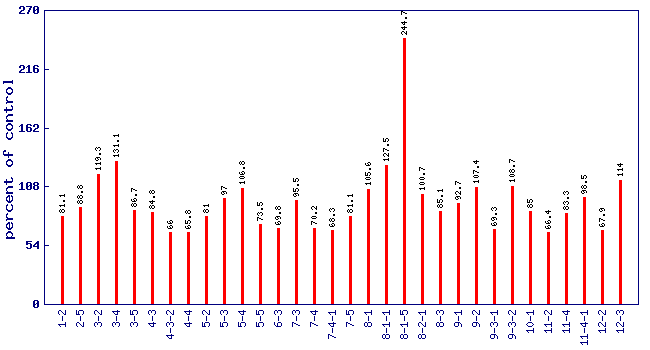 |
| line | relative level (percent of control) | p value | FDR |
|---|
| 1-2 | 81.1 | 0.575376 | 0.812904 |
| 2-5 | 88.8 | 0.706339 | 0.877095 |
| 3-2 | 119.3 | 0.56179 | 0.807086 |
| 3-4 | 131.1 | 0.468018 | 0.736215 |
| 3-5 | 86.7 | 0.649813 | 0.854102 |
| 4-3 | 84.8 | 0.602002 | 0.82717 |
| 4-3-2 | 66 | 0.173244 | 0.428655 |
| 4-4 | 65.8 | 0.169709 | 0.421681 |
| 5-2 | 81 | 0.505044 | 0.764543 |
| 5-3 | 97 | 0.925518 | 0.967435 |
| 5-4 | 106.8 | 0.873751 | 0.947246 |
| 5-5 | 73.5 | 0.328006 | 0.611898 |
| 6-3 | 69.8 | 0.275473 | 0.561143 |
| 7-3 | 95.5 | 0.877646 | 0.94748 |
| 7-4 | 70.2 | 0.344782 | 0.629741 |
| 7-4-1 | 68.3 | 0.210906 | 0.483301 |
| 7-5 | 81.1 | 0.480467 | 0.747032 |
| 8-1 | 105.6 | 0.854245 | 0.938694 |
| 8-1-1 | 127.5 | 0.441299 | 0.711266 |
| 8-1-5 | 244.7 | 0.0114416 | 0.0704411 |
| 8-2-1 | 100.7 | 0.980892 | 0.988015 |
| 8-3 | 85.1 | 0.607465 | 0.830149 |
| 9-1 | 92.7 | 0.808598 | 0.919765 |
| 9-2 | 107.4 | 0.81572 | 0.922085 |
| 9-3-1 | 69.3 | 0.245045 | 0.524333 |
| 9-3-2 | 108.7 | 0.774235 | 0.906928 |
| 10-1 | 85 | 0.605301 | 0.829343 |
| 11-2 | 66.4 | 0.194185 | 0.45855 |
| 11-4 | 83.3 | 0.57805 | 0.816193 |
| 11-4-1 | 98.5 | 0.958694 | 0.981163 |
| 12-2 | 67.9 | 0.203574 | 0.471637 |
| 12-3 | 114 | 0.66675 | 0.86195 |
* Note
- A value of zero means the beta damascenone concentration wasbelow the level of dection
- No measure of beta damascenone was performed on lines notshown in the figure and table
|
|


