 |
 |
 |
 |
 |
 |
 |
 |
 |
 |
 |
 |
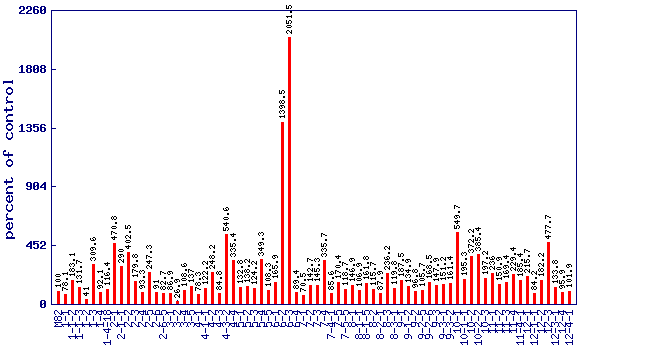
| Relative beta ionone level (percent of control)* Experiment: flavor related metabolite profiling in S. pennellii IL lines (FL, Spring 2003, Field) |
 |
| line | relative level (percent of control) |
|---|---|
| M82 | 100 |
| 1-1 | 78.1 |
| 1-1-2 | 183.1 |
| 1-1-3 | 131.7 |
| 1-2 | 41 |
| 1-3 | 309.6 |
| 1-4 | 92.1 |
| 1-4-18 | 116.4 |
| 2-1 | 470.8 |
| 2-1-1 | 290 |
| 2-2 | 402.5 |
| 2-3 | 179.8 |
| 2-4 | 93.3 |
| 2-5 | 247.3 |
| 2-6 | 91 |
| 2-6-5 | 82.7 |
| 3-1 | 86.9 |
| 3-2 | 26.9 |
| 3-4 | 108.6 |
| 3-5 | 137 |
| 4-1 | 78.3 |
| 4-1-1 | 122.2 |
| 4-2 | 248.2 |
| 4-3 | 84.8 |
| 4-3-2 | 540.6 |
| 4-4 | 335.4 |
| 5-1 | 132.8 |
| 5-2 | 138.2 |
| 5-3 | 124.2 |
| 5-4 | 349.3 |
| 5-5 | 108.3 |
| 6-1 | 165.9 |
| 6-2 | 1398.5 |
| 6-3 | 2051.5 |
| 6-4 | 89.4 |
| 7-1 | 70.5 |
| 7-2 | 142.7 |
| 7-3 | 145.3 |
| 7-4 | 335.7 |
| 7-4-1 | 85.6 |
| 7-5 | 170.4 |
| 7-5-5 | 118.7 |
| 8-1 | 146.9 |
| 8-1-1 | 106.9 |
| 8-1-5 | 161.8 |
| 8-2 | 115.7 |
| 8-2-1 | 87.9 |
| 8-3 | 236.2 |
| 8-3-1 | 119.8 |
| 9-1 | 187.5 |
| 9-1-2 | 134.9 |
| 9-2 | 96.8 |
| 9-2-5 | 105.7 |
| 9-2-6 | 168.5 |
| 9-3 | 147.9 |
| 9-3-1 | 151.2 |
| 9-3-2 | 161.4 |
| 10-1 | 549.7 |
| 10-1-1 | 195.3 |
| 10-2 | 372.2 |
| 10-2-2 | 385.4 |
| 10-3 | 197.2 |
| 11-1 | 236 |
| 11-2 | 150.9 |
| 11-3 | 169.4 |
| 11-4 | 229.4 |
| 11-4-1 | 185.4 |
| 12-1 | 215.7 |
| 12-1-1 | 84.2 |
| 12-2 | 182.2 |
| 12-3 | 477.7 |
| 12-3-1 | 133.8 |
| 12-4 | 95.9 |
| 12-4-1 | 101.9 |
* Note
|