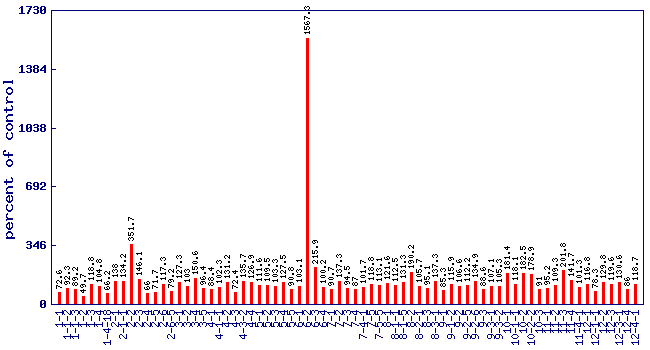
Relative beta ionone level (percent of control)*
Experiment: flavor related metabolite profiling in S. pennellii IL lines (combined)
|
 |
| line | relative level (percent of control) | p value | FDR |
|---|
| 1-1 | 72.6 | 0.309824 | 0.597844 |
| 1-1-2 | 92.3 | 0.792603 | 0.914804 |
| 1-1-3 | 89.2 | 0.70048 | 0.874858 |
| 1-2 | 49.7 | 0.0852336 | 0.271728 |
| 1-3 | 118.8 | 0.584319 | 0.820143 |
| 1-4 | 104.8 | 0.89043 | 0.954653 |
| 1-4-18 | 66.2 | 0.177145 | 0.432787 |
| 2-1 | 138 | 0.394796 | 0.67361 |
| 2-1-1 | 134.2 | 0.295395 | 0.583202 |
| 2-2 | 351.7 | 0.000463593 | 0.00572331 |
| 2-3 | 146.1 | 0.289618 | 0.577459 |
| 2-4 | 66 | 0.302952 | 0.587951 |
| 2-5 | 71.7 | 0.331408 | 0.61678 |
| 2-6 | 117.3 | 0.625918 | 0.840498 |
| 2-6-5 | 79.2 | 0.494106 | 0.756193 |
| 3-1 | 127.3 | 0.47909 | 0.745673 |
| 3-2 | 103 | 0.915997 | 0.962875 |
| 3-4 | 150.6 | 0.21335 | 0.486066 |
| 3-5 | 96.4 | 0.892213 | 0.954653 |
| 4-1 | 88.4 | 0.686996 | 0.867922 |
| 4-1-1 | 102.3 | 0.947534 | 0.978046 |
| 4-2 | 131.2 | 0.372871 | 0.651842 |
| 4-3 | 72.4 | 0.238795 | 0.517536 |
| 4-3-2 | 135.7 | 0.266644 | 0.551049 |
| 4-4 | 126.9 | 0.469062 | 0.736874 |
| 5-1 | 111.6 | 0.727245 | 0.889742 |
| 5-2 | 109.5 | 0.747499 | 0.902305 |
| 5-3 | 103.3 | 0.910657 | 0.960511 |
| 5-4 | 127.5 | 0.496683 | 0.758044 |
| 5-5 | 90.8 | 0.744144 | 0.900733 |
| 6-1 | 103.1 | 0.944001 | 0.977153 |
| 6-2 | 1567.3 | 3.98e-05 | 0.000816073 |
| 6-3 | 215.9 | 0.0250677 | 0.119414 |
| 6-4 | 100.2 | 0.996243 | 0.997512 |
| 7-1 | 90.7 | 0.756104 | 0.902305 |
| 7-2 | 137.3 | 0.467952 | 0.736215 |
| 7-3 | 94.5 | 0.848685 | 0.937526 |
| 7-4 | 87 | 0.648209 | 0.853099 |
| 7-4-1 | 101.7 | 0.949203 | 0.978091 |
| 7-5 | 118.8 | 0.532714 | 0.78496 |
| 7-5-5 | 113.1 | 0.706018 | 0.877095 |
| 8-1 | 121.6 | 0.498366 | 0.759139 |
| 8-1-1 | 112.5 | 0.660549 | 0.860064 |
| 8-1-5 | 131.3 | 0.302765 | 0.587951 |
| 8-2 | 190.2 | 0.141592 | 0.378114 |
| 8-2-1 | 105.7 | 0.810395 | 0.920034 |
| 8-3 | 95.1 | 0.865325 | 0.941637 |
| 8-3-1 | 137.3 | 0.283821 | 0.571906 |
| 9-1 | 85.3 | 0.563554 | 0.807818 |
| 9-1-2 | 115.9 | 0.665714 | 0.861083 |
| 9-2 | 106.6 | 0.789399 | 0.912077 |
| 9-2-5 | 112.2 | 0.669018 | 0.862719 |
| 9-2-6 | 134.9 | 0.360336 | 0.643406 |
| 9-3 | 88.6 | 0.690897 | 0.868409 |
| 9-3-1 | 107.1 | 0.794708 | 0.914804 |
| 9-3-2 | 105.3 | 0.831364 | 0.933165 |
| 10-1 | 181.4 | 0.0303455 | 0.134249 |
| 10-1-1 | 118.1 | 0.575357 | 0.812904 |
| 10-2 | 182.5 | 0.0927696 | 0.289178 |
| 10-2-2 | 178.9 | 0.149872 | 0.391775 |
| 10-3 | 91 | 0.78106 | 0.910768 |
| 11-1 | 95.2 | 0.880485 | 0.948325 |
| 11-2 | 109.3 | 0.746788 | 0.902305 |
| 11-3 | 201.8 | 0.0499038 | 0.186783 |
| 11-4 | 141.7 | 0.226073 | 0.500733 |
| 11-4-1 | 101.3 | 0.961604 | 0.982436 |
| 12-1 | 116.8 | 0.610859 | 0.831779 |
| 12-1-1 | 78.3 | 0.474629 | 0.742159 |
| 12-2 | 129.8 | 0.298072 | 0.583766 |
| 12-3 | 119.6 | 0.482643 | 0.748239 |
| 12-3-1 | 130.6 | 0.354961 | 0.640022 |
| 12-4 | 86 | 0.620527 | 0.837072 |
| 12-4-1 | 118.7 | 0.563537 | 0.807818 |
* Note
- A value of zero means the beta ionone concentration wasbelow the level of dection
- No measure of beta ionone was performed on lines notshown in the figure and table
|
|


