 |
 |
 |
 |
 |
 |
 |
 |
 |
 |
 |
 |
| Relative cis-2-penten-1-ol level (percent of control)* Experiment: flavor related metabolite profiling in S. pennellii IL lines (FL, Fall 2002, Greenhouse) |
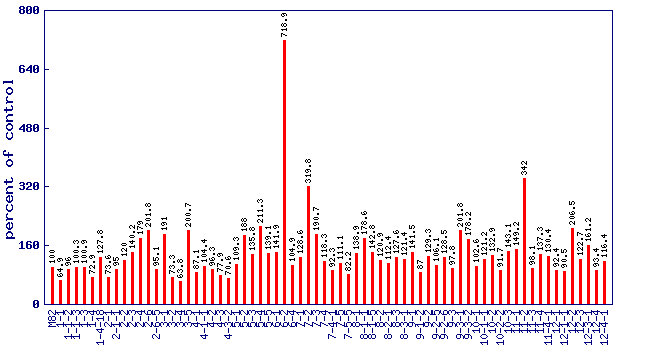 |
| line | relative level (percent of control) |
|---|---|
| M82 | 100 |
| 1-1 | 64.9 |
| 1-1-2 | 96 |
| 1-1-3 | 100.3 |
| 1-3 | 100.9 |
| 1-4 | 72.9 |
| 1-4-18 | 127.8 |
| 2-1 | 73.6 |
| 2-1-1 | 95 |
| 2-2 | 120 |
| 2-3 | 140.2 |
| 2-4 | 179 |
| 2-6 | 201.8 |
| 2-6-5 | 95.1 |
| 3-1 | 191 |
| 3-2 | 73.3 |
| 3-4 | 63.8 |
| 3-5 | 200.7 |
| 4-1 | 87.1 |
| 4-1-1 | 104.4 |
| 4-2 | 96.3 |
| 4-3 | 77.9 |
| 4-3-2 | 70.6 |
| 5-1 | 109.3 |
| 5-2 | 188 |
| 5-3 | 135.8 |
| 5-4 | 211.3 |
| 5-5 | 139.1 |
| 6-1 | 141.9 |
| 6-2 | 718.9 |
| 6-4 | 104.9 |
| 7-1 | 128.6 |
| 7-2 | 319.8 |
| 7-3 | 190.7 |
| 7-4 | 118.3 |
| 7-4-1 | 92.3 |
| 7-5 | 111.1 |
| 7-5-5 | 82.2 |
| 8-1 | 138.9 |
| 8-1-1 | 178.6 |
| 8-1-5 | 142.8 |
| 8-2 | 120.9 |
| 8-2-1 | 112.4 |
| 8-3 | 127.6 |
| 8-3-1 | 121.4 |
| 9-1 | 141.5 |
| 9-1-2 | 87 |
| 9-2 | 129.3 |
| 9-2-5 | 106.1 |
| 9-2-6 | 128.5 |
| 9-3 | 97.8 |
| 9-3-1 | 201.8 |
| 9-3-2 | 178.2 |
| 10-1 | 102.6 |
| 10-1-1 | 121.2 |
| 10-2 | 132.9 |
| 10-2-2 | 91.7 |
| 10-3 | 143.1 |
| 11-1 | 149.2 |
| 11-2 | 342 |
| 11-3 | 98.1 |
| 11-4 | 137.3 |
| 11-4-1 | 130.4 |
| 12-1 | 92.4 |
| 12-1-1 | 90.5 |
| 12-2 | 206.5 |
| 12-3 | 122.7 |
| 12-3-1 | 161.2 |
| 12-4 | 93.4 |
| 12-4-1 | 116.4 |
* Note
|