 |
 |
 |
 |
 |
 |
 |
 |
 |
 |
 |
 |
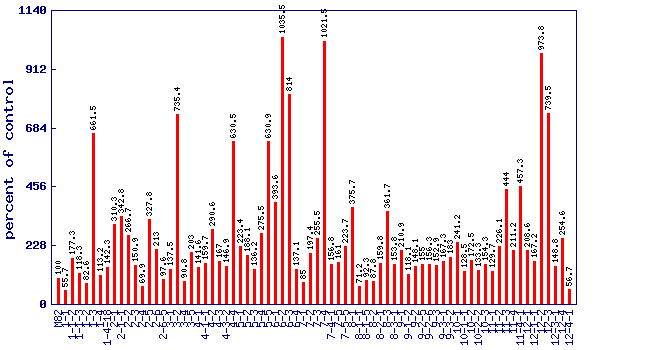
| Relative cis-2-penten-1-ol level (percent of control)* Experiment: flavor related metabolite profiling in S. pennellii IL lines (FL, Spring 2003, Field) |
 |
| line | relative level (percent of control) |
|---|---|
| M82 | 100 |
| 1-1 | 55.7 |
| 1-1-2 | 177.3 |
| 1-1-3 | 118.3 |
| 1-2 | 82.6 |
| 1-3 | 661.5 |
| 1-4 | 113.2 |
| 1-4-18 | 142.3 |
| 2-1 | 310.3 |
| 2-1-1 | 342.8 |
| 2-2 | 266.7 |
| 2-3 | 150.9 |
| 2-4 | 69.9 |
| 2-5 | 327.8 |
| 2-6 | 213 |
| 2-6-5 | 97.6 |
| 3-1 | 137.5 |
| 3-2 | 735.4 |
| 3-4 | 90.8 |
| 3-5 | 203 |
| 4-1 | 141.6 |
| 4-1-1 | 159.7 |
| 4-2 | 290.6 |
| 4-3 | 167 |
| 4-3-2 | 146.9 |
| 4-4 | 630.5 |
| 5-1 | 223.4 |
| 5-2 | 188.1 |
| 5-3 | 136.2 |
| 5-4 | 275.5 |
| 5-5 | 630.9 |
| 6-1 | 393.6 |
| 6-2 | 1035.5 |
| 6-3 | 814 |
| 6-4 | 137.1 |
| 7-1 | 85 |
| 7-2 | 197.4 |
| 7-3 | 255.5 |
| 7-4 | 1021.5 |
| 7-4-1 | 156.8 |
| 7-5 | 161 |
| 7-5-5 | 223.7 |
| 8-1 | 375.7 |
| 8-1-1 | 71.2 |
| 8-1-5 | 92.3 |
| 8-2 | 87.8 |
| 8-2-1 | 159.8 |
| 8-3 | 361.7 |
| 8-3-1 | 153.8 |
| 9-1 | 210.9 |
| 9-1-2 | 118.1 |
| 9-2 | 148.1 |
| 9-2-5 | 155 |
| 9-2-6 | 156.3 |
| 9-3 | 152.9 |
| 9-3-1 | 167.3 |
| 9-3-2 | 183 |
| 10-1 | 241.2 |
| 10-1-1 | 128.5 |
| 10-2 | 172.5 |
| 10-2-2 | 133.3 |
| 10-3 | 154.3 |
| 11-1 | 129.7 |
| 11-2 | 226.1 |
| 11-3 | 444 |
| 11-4 | 211.2 |
| 11-4-1 | 457.3 |
| 12-1 | 208.6 |
| 12-1-1 | 167.2 |
| 12-2 | 973.8 |
| 12-3 | 739.5 |
| 12-3-1 | 148.8 |
| 12-4 | 254.6 |
| 12-4-1 | 56.7 |
* Note
|