 |
 |
 |
 |
 |
 |
 |
 |
 |
 |
 |
 |
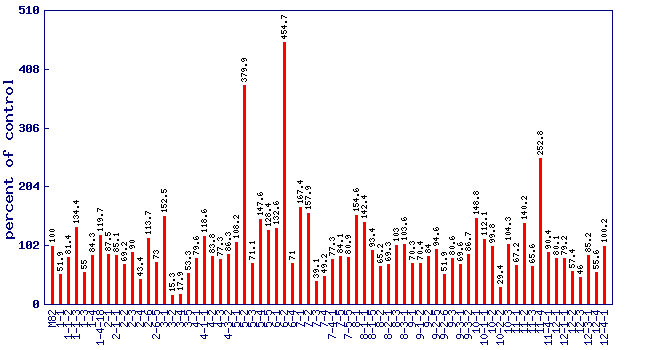
| Relative cis-3-hexen-1-ol level (percent of control)* Experiment: flavor related metabolite profiling in S. pennellii IL lines (FL, Fall 2002, Greenhouse) |
 |
| line | relative level (percent of control) |
|---|---|
| M82 | 100 |
| 1-1 | 51.9 |
| 1-1-2 | 81.4 |
| 1-1-3 | 134.4 |
| 1-3 | 55 |
| 1-4 | 84.3 |
| 1-4-18 | 119.7 |
| 2-1 | 87.5 |
| 2-1-1 | 85.1 |
| 2-2 | 69.2 |
| 2-3 | 90 |
| 2-4 | 43.4 |
| 2-6 | 113.7 |
| 2-6-5 | 73 |
| 3-1 | 152.5 |
| 3-2 | 15.3 |
| 3-4 | 17.9 |
| 3-5 | 53.3 |
| 4-1 | 79.6 |
| 4-1-1 | 118.6 |
| 4-2 | 83.8 |
| 4-3 | 77.3 |
| 4-3-2 | 86.3 |
| 5-1 | 108.2 |
| 5-2 | 379.9 |
| 5-3 | 71.1 |
| 5-4 | 147.6 |
| 5-5 | 128.4 |
| 6-1 | 132.6 |
| 6-2 | 454.7 |
| 6-4 | 71 |
| 7-1 | 167.4 |
| 7-2 | 157.9 |
| 7-3 | 39.1 |
| 7-4 | 49.2 |
| 7-4-1 | 77.3 |
| 7-5 | 84.1 |
| 7-5-5 | 80.9 |
| 8-1 | 154.6 |
| 8-1-1 | 142.4 |
| 8-1-5 | 93.4 |
| 8-2 | 65.2 |
| 8-2-1 | 69.3 |
| 8-3 | 103 |
| 8-3-1 | 103.6 |
| 9-1 | 70.3 |
| 9-1-2 | 70.4 |
| 9-2 | 84 |
| 9-2-5 | 94.6 |
| 9-2-6 | 51.9 |
| 9-3 | 80.6 |
| 9-3-1 | 69.6 |
| 9-3-2 | 86.7 |
| 10-1 | 148.8 |
| 10-1-1 | 112.1 |
| 10-2 | 99.8 |
| 10-2-2 | 29.4 |
| 10-3 | 104.3 |
| 11-1 | 67.2 |
| 11-2 | 140.2 |
| 11-3 | 65.6 |
| 11-4 | 252.8 |
| 11-4-1 | 90.4 |
| 12-1 | 80.1 |
| 12-1-1 | 79.2 |
| 12-2 | 57.4 |
| 12-3 | 46 |
| 12-3-1 | 85.2 |
| 12-4 | 55.6 |
| 12-4-1 | 100.2 |
* Note
|