 |
 |
 |
 |
 |
 |
 |
 |
 |
 |
 |
 |
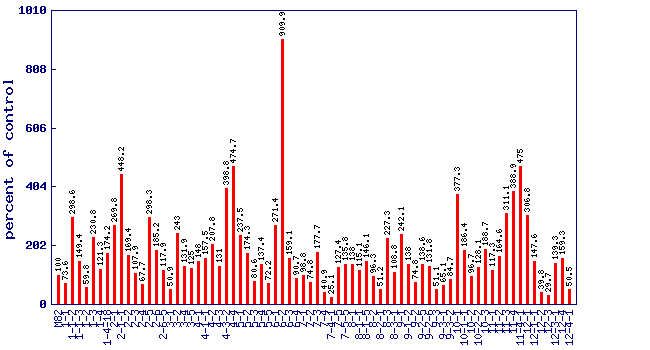
| Relative cis-3-hexen-1-ol level (percent of control)* Experiment: flavor related metabolite profiling in S. pennellii IL lines (FL, Spring 2003, Field) |
 |
| line | relative level (percent of control) |
|---|---|
| M82 | 100 |
| 1-1 | 73.6 |
| 1-1-2 | 298.6 |
| 1-1-3 | 149.4 |
| 1-2 | 59.8 |
| 1-3 | 230.8 |
| 1-4 | 121.3 |
| 1-4-18 | 174.2 |
| 2-1 | 269.8 |
| 2-1-1 | 448.2 |
| 2-2 | 169.4 |
| 2-3 | 107.9 |
| 2-4 | 67.7 |
| 2-5 | 298.3 |
| 2-6 | 185.2 |
| 2-6-5 | 117.9 |
| 3-1 | 50.9 |
| 3-2 | 243 |
| 3-4 | 131.9 |
| 3-5 | 125 |
| 4-1 | 148 |
| 4-1-1 | 157.5 |
| 4-2 | 207.8 |
| 4-3 | 131 |
| 4-3-2 | 398.8 |
| 4-4 | 474.7 |
| 5-1 | 237.5 |
| 5-2 | 174.3 |
| 5-3 | 80.6 |
| 5-4 | 137.4 |
| 5-5 | 72.2 |
| 6-1 | 271.4 |
| 6-2 | 909.9 |
| 6-3 | 159.1 |
| 6-4 | 90.7 |
| 7-1 | 98.8 |
| 7-2 | 74.8 |
| 7-3 | 177.7 |
| 7-4 | 40.9 |
| 7-4-1 | 25.1 |
| 7-5 | 127.4 |
| 7-5-5 | 135.8 |
| 8-1 | 138 |
| 8-1-1 | 115.1 |
| 8-1-5 | 146.1 |
| 8-2 | 96.3 |
| 8-2-1 | 51.2 |
| 8-3 | 227.3 |
| 8-3-1 | 108.8 |
| 9-1 | 242.1 |
| 9-1-2 | 138 |
| 9-2 | 74.8 |
| 9-2-5 | 138.6 |
| 9-2-6 | 131.8 |
| 9-3 | 51.1 |
| 9-3-1 | 65.1 |
| 9-3-2 | 84.7 |
| 10-1 | 377.3 |
| 10-1-1 | 186.4 |
| 10-2 | 96.7 |
| 10-2-2 | 128.1 |
| 10-3 | 188.7 |
| 11-1 | 117.3 |
| 11-2 | 164.6 |
| 11-3 | 311.1 |
| 11-4 | 388.9 |
| 11-4-1 | 475 |
| 12-1 | 306.8 |
| 12-1-1 | 147.6 |
| 12-2 | 39.8 |
| 12-3 | 29.7 |
| 12-3-1 | 139.3 |
| 12-4 | 159.3 |
| 12-4-1 | 50.5 |
* Note
|