 |
 |
 |
 |
 |
 |
 |
 |
 |
 |
 |
 |
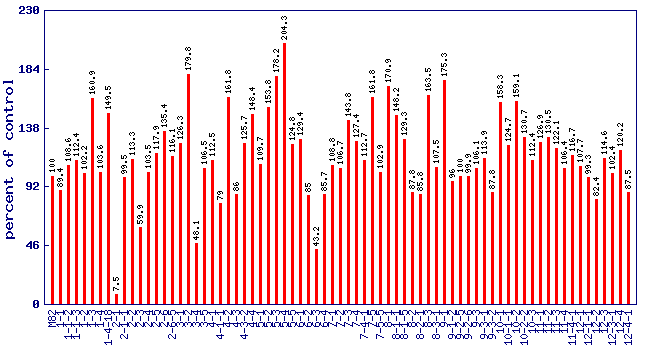
| Relative citric acid level (percent of control)* Experiment: flavor related metabolite profiling in S. pennellii IL lines (FL, Spring 2003, Field) |
 |
| line | relative level (percent of control) |
|---|---|
| M82 | 100 |
| 1-1 | 89.4 |
| 1-1-2 | 108.6 |
| 1-1-3 | 112.4 |
| 1-2 | 102.2 |
| 1-3 | 160.9 |
| 1-4 | 103.6 |
| 1-4-18 | 149.5 |
| 2-1 | 7.5 |
| 2-1-1 | 99.5 |
| 2-2 | 113.3 |
| 2-3 | 59.9 |
| 2-4 | 103.5 |
| 2-5 | 117.9 |
| 2-6 | 135.4 |
| 2-6-5 | 116.1 |
| 3-1 | 126.3 |
| 3-2 | 179.8 |
| 3-4 | 48.1 |
| 3-5 | 106.5 |
| 4-1 | 112.5 |
| 4-1-1 | 79 |
| 4-2 | 161.8 |
| 4-3 | 86 |
| 4-3-2 | 125.7 |
| 4-4 | 148.4 |
| 5-1 | 109.7 |
| 5-2 | 153.8 |
| 5-3 | 178.2 |
| 5-4 | 204.3 |
| 5-5 | 124.8 |
| 6-1 | 129.4 |
| 6-2 | 85 |
| 6-3 | 43.2 |
| 6-4 | 85.7 |
| 7-1 | 108.8 |
| 7-2 | 106.7 |
| 7-3 | 143.8 |
| 7-4 | 127.4 |
| 7-4-1 | 112.7 |
| 7-5 | 161.8 |
| 7-5-5 | 102.9 |
| 8-1 | 170.9 |
| 8-1-1 | 148.2 |
| 8-1-5 | 129.3 |
| 8-2 | 87.8 |
| 8-2-1 | 85.8 |
| 8-3 | 163.5 |
| 8-3-1 | 107.5 |
| 9-1 | 175.3 |
| 9-1-2 | 96 |
| 9-2-5 | 100 |
| 9-2-6 | 99.9 |
| 9-3 | 106.1 |
| 9-3-1 | 113.9 |
| 9-3-2 | 87.8 |
| 10-1 | 158.3 |
| 10-1-1 | 124.7 |
| 10-2 | 159.1 |
| 10-2-2 | 130.7 |
| 10-3 | 112.4 |
| 11-1 | 126.9 |
| 11-2 | 130.5 |
| 11-3 | 122.1 |
| 11-4 | 106.4 |
| 11-4-1 | 116.7 |
| 12-1 | 107.7 |
| 12-1-1 | 99.3 |
| 12-2 | 82.4 |
| 12-3 | 114.6 |
| 12-3-1 | 102.4 |
| 12-4 | 120.2 |
| 12-4-1 | 87.5 |
* Note
|