 |
 |
 |
 |
 |
 |
 |
 |
 |
 |
 |
 |
| Relative citric acid level (percent of control)* Experiment: flavor related metabolite profiling in S. pennellii IL lines (FL, Fall 2003, Field) |
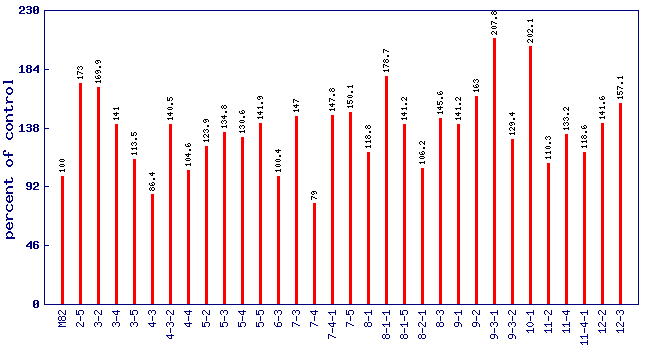 |
| line | relative level (percent of control) |
|---|---|
| M82 | 100 |
| 2-5 | 173 |
| 3-2 | 169.9 |
| 3-4 | 141 |
| 3-5 | 113.5 |
| 4-3 | 86.4 |
| 4-3-2 | 140.5 |
| 4-4 | 104.6 |
| 5-2 | 123.9 |
| 5-3 | 134.8 |
| 5-4 | 130.6 |
| 5-5 | 141.9 |
| 6-3 | 100.4 |
| 7-3 | 147 |
| 7-4 | 79 |
| 7-4-1 | 147.8 |
| 7-5 | 150.1 |
| 8-1 | 118.8 |
| 8-1-1 | 178.7 |
| 8-1-5 | 141.2 |
| 8-2-1 | 106.2 |
| 8-3 | 145.6 |
| 9-1 | 141.2 |
| 9-2 | 163 |
| 9-3-1 | 207.8 |
| 9-3-2 | 129.4 |
| 10-1 | 202.1 |
| 11-2 | 110.3 |
| 11-4 | 133.2 |
| 11-4-1 | 118.6 |
| 12-2 | 141.6 |
| 12-3 | 157.1 |
* Note
|