 |
 |
 |
 |
 |
 |
 |
 |
 |
 |
 |
 |
| Relative fructose level (percent of control)* Experiment: flavor related metabolite profiling in S. pennellii IL lines (FL, Fall 2002, Greenhouse) |
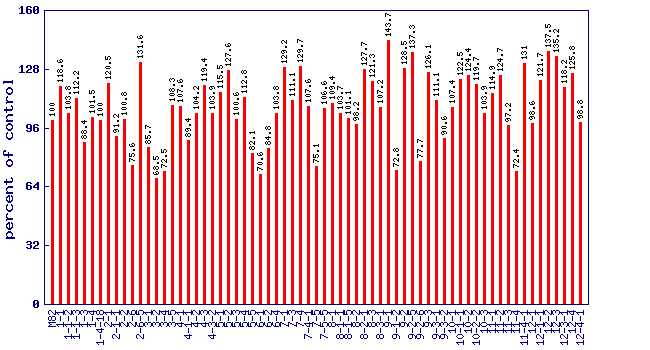 |
| line | relative level (percent of control) |
|---|---|
| M82 | 100 |
| 1-1 | 118.6 |
| 1-1-2 | 103.8 |
| 1-1-3 | 112.2 |
| 1-3 | 88.4 |
| 1-4 | 101.5 |
| 1-4-18 | 100 |
| 2-1 | 120.5 |
| 2-1-1 | 91.2 |
| 2-2 | 100.8 |
| 2-6 | 75.6 |
| 2-6-5 | 131.6 |
| 3-1 | 85.7 |
| 3-2 | 68.5 |
| 3-4 | 72.5 |
| 3-5 | 108.3 |
| 4-1 | 107.6 |
| 4-1-1 | 89.4 |
| 4-2 | 104.2 |
| 4-3 | 119.4 |
| 4-3-2 | 103.9 |
| 5-1 | 115.5 |
| 5-2 | 127.6 |
| 5-3 | 100.6 |
| 5-4 | 112.8 |
| 5-5 | 82.1 |
| 6-1 | 70.6 |
| 6-2 | 84.8 |
| 6-4 | 103.8 |
| 7-1 | 129.2 |
| 7-3 | 111.1 |
| 7-4 | 129.7 |
| 7-4-1 | 107.6 |
| 7-5 | 75.1 |
| 7-5-5 | 106.6 |
| 8-1 | 109.4 |
| 8-1-1 | 103.7 |
| 8-1-5 | 101.1 |
| 8-2 | 98.2 |
| 8-2-1 | 127.7 |
| 8-3 | 121.3 |
| 8-3-1 | 107.2 |
| 9-1 | 143.7 |
| 9-1-2 | 72.8 |
| 9-2 | 128.5 |
| 9-2-5 | 137.3 |
| 9-2-6 | 77.7 |
| 9-3 | 126.1 |
| 9-3-1 | 111.1 |
| 9-3-2 | 90.6 |
| 10-1 | 107.4 |
| 10-1-1 | 122.5 |
| 10-2 | 124.4 |
| 10-2-2 | 119.7 |
| 10-3 | 103.9 |
| 11-1 | 114.9 |
| 11-2 | 124.7 |
| 11-3 | 97.2 |
| 11-4 | 72.4 |
| 11-4-1 | 131 |
| 12-1 | 98.6 |
| 12-1-1 | 121.7 |
| 12-2 | 137.5 |
| 12-3 | 135.2 |
| 12-3-1 | 118.2 |
| 12-4 | 125.8 |
| 12-4-1 | 98.8 |
* Note
|