 |
 |
 |
 |
 |
 |
 |
 |
 |
 |
 |
 |
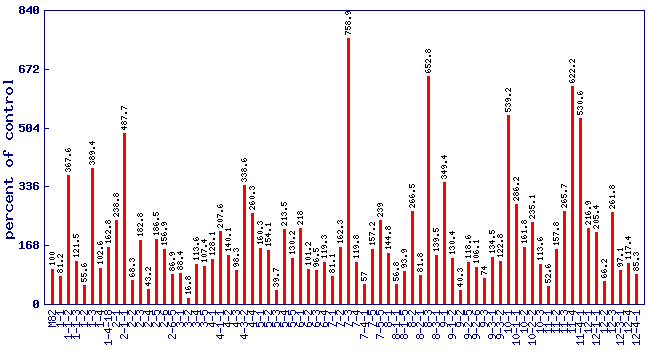
| Relative geranylacetone level (percent of control)* Experiment: flavor related metabolite profiling in S. pennellii IL lines (FL, Spring 2003, Field) |
 |
| line | relative level (percent of control) |
|---|---|
| M82 | 100 |
| 1-1 | 81.2 |
| 1-1-2 | 367.6 |
| 1-1-3 | 121.5 |
| 1-2 | 55.6 |
| 1-3 | 389.4 |
| 1-4 | 102.6 |
| 1-4-18 | 162.8 |
| 2-1 | 238.8 |
| 2-1-1 | 487.7 |
| 2-2 | 68.3 |
| 2-3 | 182.8 |
| 2-4 | 43.2 |
| 2-5 | 186.5 |
| 2-6 | 156.9 |
| 2-6-5 | 86.9 |
| 3-1 | 88.4 |
| 3-2 | 16.8 |
| 3-4 | 113.6 |
| 3-5 | 107.4 |
| 4-1 | 128.1 |
| 4-1-1 | 207.6 |
| 4-2 | 140.1 |
| 4-3 | 98.3 |
| 4-3-2 | 338.6 |
| 4-4 | 260.3 |
| 5-1 | 160.3 |
| 5-2 | 154.1 |
| 5-3 | 39.7 |
| 5-4 | 213.5 |
| 5-5 | 130.2 |
| 6-1 | 218 |
| 6-2 | 101.2 |
| 6-3 | 96.5 |
| 6-4 | 119.3 |
| 7-1 | 81.1 |
| 7-2 | 162.3 |
| 7-3 | 758.9 |
| 7-4 | 119.8 |
| 7-4-1 | 57 |
| 7-5 | 157.2 |
| 7-5-5 | 239 |
| 8-1 | 144.8 |
| 8-1-1 | 56.8 |
| 8-1-5 | 93.9 |
| 8-2 | 266.5 |
| 8-2-1 | 81.8 |
| 8-3 | 652.8 |
| 8-3-1 | 139.5 |
| 9-1 | 349.4 |
| 9-1-2 | 130.4 |
| 9-2 | 40.3 |
| 9-2-5 | 118.6 |
| 9-2-6 | 106.1 |
| 9-3 | 74 |
| 9-3-1 | 134.5 |
| 9-3-2 | 122.8 |
| 10-1 | 539.2 |
| 10-1-1 | 286.2 |
| 10-2 | 161.8 |
| 10-2-2 | 235.1 |
| 10-3 | 113.6 |
| 11-1 | 52.6 |
| 11-2 | 157.8 |
| 11-3 | 265.7 |
| 11-4 | 622.2 |
| 11-4-1 | 530.6 |
| 12-1 | 216.9 |
| 12-1-1 | 205.4 |
| 12-2 | 66.2 |
| 12-3 | 261.8 |
| 12-3-1 | 97.1 |
| 12-4 | 117.4 |
| 12-4-1 | 85.3 |
* Note
|