 |
 |
 |
 |
 |
 |
 |
 |
 |
 |
 |
 |
| Relative glucose level (percent of control)* Experiment: flavor related metabolite profiling in S. pennellii IL lines (FL, Fall 2002, Greenhouse) |
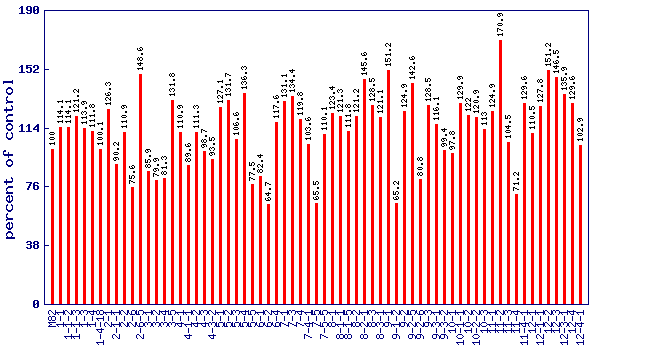 |
| line | relative level (percent of control) |
|---|---|
| M82 | 100 |
| 1-1 | 114.1 |
| 1-1-2 | 114.1 |
| 1-1-3 | 121.2 |
| 1-3 | 113.9 |
| 1-4 | 111.8 |
| 1-4-18 | 100.1 |
| 2-1 | 126.3 |
| 2-1-1 | 90.2 |
| 2-2 | 110.9 |
| 2-6 | 75.6 |
| 2-6-5 | 148.6 |
| 3-1 | 85.9 |
| 3-2 | 79.9 |
| 3-4 | 81.3 |
| 3-5 | 131.8 |
| 4-1 | 110.9 |
| 4-1-1 | 89.6 |
| 4-2 | 111.3 |
| 4-3 | 98.7 |
| 4-3-2 | 93.5 |
| 5-1 | 127.1 |
| 5-2 | 131.7 |
| 5-3 | 106.6 |
| 5-4 | 136.3 |
| 5-5 | 77.5 |
| 6-1 | 82.4 |
| 6-2 | 64.7 |
| 6-4 | 117.6 |
| 7-1 | 131.1 |
| 7-3 | 134.4 |
| 7-4 | 119.8 |
| 7-4-1 | 103.6 |
| 7-5 | 65.5 |
| 7-5-5 | 110.1 |
| 8-1 | 123.4 |
| 8-1-1 | 121.3 |
| 8-1-5 | 111.8 |
| 8-2 | 121.2 |
| 8-2-1 | 145.6 |
| 8-3 | 128.5 |
| 8-3-1 | 121.1 |
| 9-1 | 151.2 |
| 9-1-2 | 65.2 |
| 9-2 | 124.9 |
| 9-2-5 | 142.6 |
| 9-2-6 | 80.8 |
| 9-3 | 128.5 |
| 9-3-1 | 116.1 |
| 9-3-2 | 99.4 |
| 10-1 | 97.8 |
| 10-1-1 | 129.9 |
| 10-2 | 122 |
| 10-2-2 | 120.9 |
| 10-3 | 113 |
| 11-1 | 124.9 |
| 11-2 | 170.9 |
| 11-3 | 104.5 |
| 11-4 | 71.2 |
| 11-4-1 | 129.6 |
| 12-1 | 110.5 |
| 12-1-1 | 127.8 |
| 12-2 | 151.2 |
| 12-3 | 146.5 |
| 12-3-1 | 135.9 |
| 12-4 | 129.6 |
| 12-4-1 | 102.9 |
* Note
|