 |
 |
 |
 |
 |
 |
 |
 |
 |
 |
 |
 |
| Relative isobutyl acetate level (percent of control)* Experiment: flavor related metabolite profiling in S. pennellii IL lines (FL, Fall 2002, Greenhouse) |
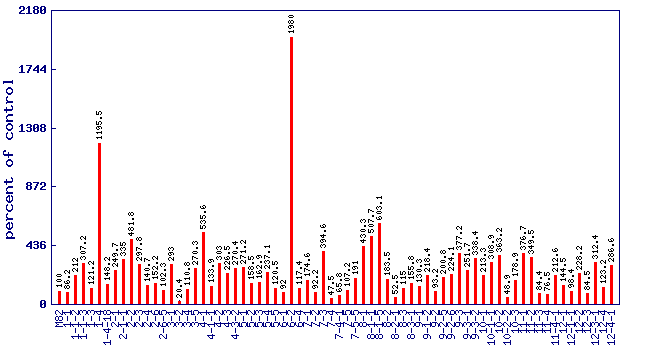 |
| line | relative level (percent of control) |
|---|---|
| M82 | 100 |
| 1-1 | 86.2 |
| 1-1-2 | 212 |
| 1-1-3 | 307.2 |
| 1-3 | 121.2 |
| 1-4 | 1195.5 |
| 1-4-18 | 148.2 |
| 2-1 | 249.7 |
| 2-1-1 | 335 |
| 2-2 | 481.8 |
| 2-3 | 297.8 |
| 2-4 | 140.7 |
| 2-6 | 152.2 |
| 2-6-5 | 102.3 |
| 3-1 | 293 |
| 3-2 | 20.4 |
| 3-4 | 110.8 |
| 3-5 | 270.3 |
| 4-1 | 535.6 |
| 4-1-1 | 133.9 |
| 4-2 | 303 |
| 4-3 | 226.5 |
| 4-3-2 | 270.4 |
| 5-1 | 271.2 |
| 5-2 | 158.5 |
| 5-3 | 162.9 |
| 5-4 | 237.1 |
| 5-5 | 120.5 |
| 6-1 | 92 |
| 6-2 | 1980 |
| 6-4 | 117.4 |
| 7-1 | 174.6 |
| 7-2 | 92.2 |
| 7-3 | 394.6 |
| 7-4 | 47.5 |
| 7-4-1 | 65.8 |
| 7-5 | 107.2 |
| 7-5-5 | 191 |
| 8-1 | 430.3 |
| 8-1-1 | 507.7 |
| 8-1-5 | 603.1 |
| 8-2 | 183.5 |
| 8-2-1 | 52.5 |
| 8-3 | 115 |
| 8-3-1 | 155.8 |
| 9-1 | 130.3 |
| 9-1-2 | 218.4 |
| 9-2 | 93.2 |
| 9-2-5 | 200.8 |
| 9-2-6 | 224.1 |
| 9-3 | 377.2 |
| 9-3-1 | 251.7 |
| 9-3-2 | 338.4 |
| 10-1 | 213.3 |
| 10-1-1 | 308.9 |
| 10-2 | 363.2 |
| 10-2-2 | 48.9 |
| 10-3 | 178.9 |
| 11-1 | 376.7 |
| 11-2 | 349.5 |
| 11-3 | 84.4 |
| 11-4 | 76.5 |
| 11-4-1 | 212.6 |
| 12-1 | 144.5 |
| 12-1-1 | 98.4 |
| 12-2 | 228.2 |
| 12-3 | 84.5 |
| 12-3-1 | 312.4 |
| 12-4 | 123.2 |
| 12-4-1 | 286.6 |
* Note
|