 |
 |
 |
 |
 |
 |
 |
 |
 |
 |
 |
 |
| Relative 3-methylbutanal level (percent of control)* Experiment: flavor related metabolite profiling in S. pennellii IL lines (FL, Fall 2002, Greenhouse) |
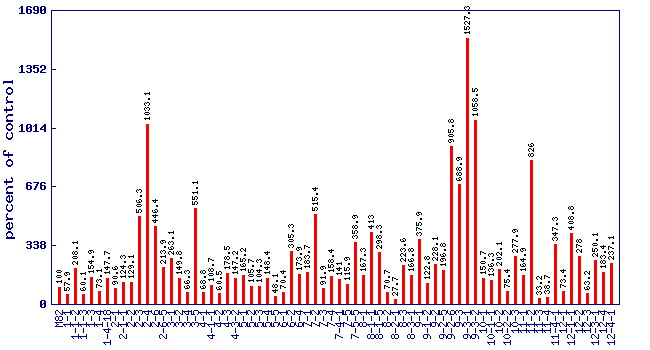 |
| line | relative level (percent of control) |
|---|---|
| M82 | 100 |
| 1-1 | 57.9 |
| 1-1-2 | 208.1 |
| 1-1-3 | 60.1 |
| 1-3 | 154.9 |
| 1-4 | 73.1 |
| 1-4-18 | 147.7 |
| 2-1 | 90.6 |
| 2-1-1 | 124.3 |
| 2-2 | 129.1 |
| 2-3 | 506.3 |
| 2-4 | 1033.1 |
| 2-6 | 446.4 |
| 2-6-5 | 213.9 |
| 3-1 | 263.1 |
| 3-2 | 149.8 |
| 3-4 | 66.3 |
| 3-5 | 551.1 |
| 4-1 | 68.8 |
| 4-1-1 | 108.7 |
| 4-2 | 60.5 |
| 4-3 | 178.5 |
| 4-3-2 | 147.2 |
| 5-1 | 165.2 |
| 5-2 | 105.7 |
| 5-3 | 104.3 |
| 5-4 | 148.4 |
| 5-5 | 48.1 |
| 6-1 | 70.4 |
| 6-2 | 305.3 |
| 6-4 | 173.9 |
| 7-1 | 183.7 |
| 7-2 | 515.4 |
| 7-3 | 91.9 |
| 7-4 | 158.4 |
| 7-4-1 | 141 |
| 7-5 | 115.9 |
| 7-5-5 | 358.9 |
| 8-1 | 167.3 |
| 8-1-1 | 413 |
| 8-1-5 | 298.3 |
| 8-2 | 70.7 |
| 8-2-1 | 27.7 |
| 8-3 | 223.6 |
| 8-3-1 | 166.8 |
| 9-1 | 375.9 |
| 9-1-2 | 122.8 |
| 9-2 | 228.1 |
| 9-2-5 | 196.8 |
| 9-2-6 | 905.8 |
| 9-3 | 688.9 |
| 9-3-1 | 1527.3 |
| 9-3-2 | 1058.5 |
| 10-1 | 150.7 |
| 10-1-1 | 136.3 |
| 10-2 | 202.1 |
| 10-2-2 | 75.4 |
| 10-3 | 277.9 |
| 11-1 | 164.9 |
| 11-2 | 826 |
| 11-3 | 33.2 |
| 11-4 | 38.7 |
| 11-4-1 | 347.3 |
| 12-1 | 73.4 |
| 12-1-1 | 408.8 |
| 12-2 | 278 |
| 12-3 | 63.2 |
| 12-3-1 | 250.1 |
| 12-4 | 183.4 |
| 12-4-1 | 237.1 |
* Note
|