 |
 |
 |
 |
 |
 |
 |
 |
 |
 |
 |
 |
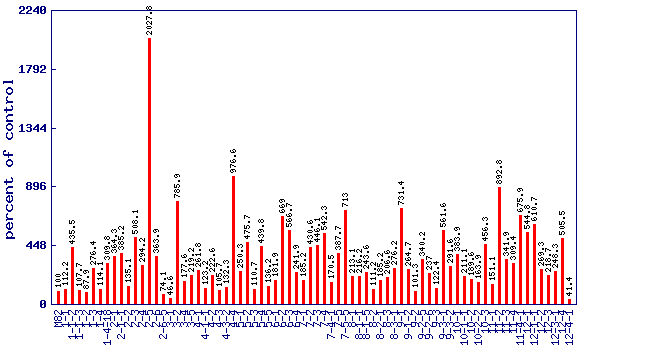
| Relative 3-methylbutanal level (percent of control)* Experiment: flavor related metabolite profiling in S. pennellii IL lines (FL, Spring 2003, Field) |
 |
| line | relative level (percent of control) |
|---|---|
| M82 | 100 |
| 1-1 | 112.2 |
| 1-1-2 | 435.5 |
| 1-1-3 | 107.7 |
| 1-2 | 87.9 |
| 1-3 | 276.4 |
| 1-4 | 114.1 |
| 1-4-18 | 309.8 |
| 2-1 | 364.3 |
| 2-1-1 | 385.2 |
| 2-2 | 135.1 |
| 2-3 | 508.1 |
| 2-4 | 294.2 |
| 2-5 | 2027.8 |
| 2-6 | 363.9 |
| 2-6-5 | 74.1 |
| 3-1 | 46.6 |
| 3-2 | 785.9 |
| 3-4 | 177.6 |
| 3-5 | 219.2 |
| 4-1 | 261.8 |
| 4-1-1 | 123.2 |
| 4-2 | 222.6 |
| 4-3 | 105.7 |
| 4-3-2 | 132.3 |
| 4-4 | 976.6 |
| 5-1 | 250.3 |
| 5-2 | 475.7 |
| 5-3 | 110.7 |
| 5-4 | 439.8 |
| 5-5 | 136.2 |
| 6-1 | 181.9 |
| 6-2 | 669 |
| 6-3 | 566.7 |
| 6-4 | 241.9 |
| 7-1 | 185.2 |
| 7-2 | 430.6 |
| 7-3 | 446.1 |
| 7-4 | 542.3 |
| 7-4-1 | 170.5 |
| 7-5 | 387.7 |
| 7-5-5 | 713 |
| 8-1 | 213.1 |
| 8-1-1 | 216.2 |
| 8-1-5 | 243.6 |
| 8-2 | 111.2 |
| 8-2-1 | 185.2 |
| 8-3 | 206.6 |
| 8-3-1 | 276.2 |
| 9-1 | 731.4 |
| 9-1-2 | 264.7 |
| 9-2 | 101.3 |
| 9-2-5 | 340.2 |
| 9-2-6 | 237 |
| 9-3 | 122.4 |
| 9-3-1 | 561.6 |
| 9-3-2 | 291.6 |
| 10-1 | 383.9 |
| 10-1-1 | 211.1 |
| 10-2 | 189.6 |
| 10-2-2 | 163.9 |
| 10-3 | 456.3 |
| 11-1 | 151.1 |
| 11-2 | 892.8 |
| 11-3 | 341.9 |
| 11-4 | 309.4 |
| 11-4-1 | 675.9 |
| 12-1 | 544.8 |
| 12-1-1 | 610.7 |
| 12-2 | 269.3 |
| 12-3 | 218.7 |
| 12-3-1 | 248.3 |
| 12-4 | 505.5 |
| 12-4-1 | 41.4 |
* Note
|