 |
 |
 |
 |
 |
 |
 |
 |
 |
 |
 |
 |
| Relative malic acid level (percent of control)* Experiment: flavor related metabolite profiling in S. pennellii IL lines (FL, Fall 2002, Greenhouse) |
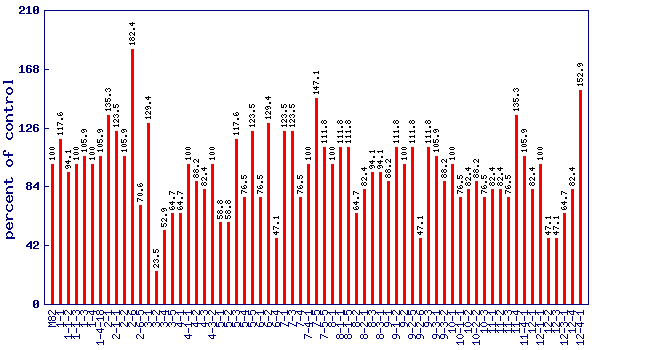 |
| line | relative level (percent of control) |
|---|---|
| M82 | 100 |
| 1-1 | 117.6 |
| 1-1-2 | 94.1 |
| 1-1-3 | 100 |
| 1-3 | 105.9 |
| 1-4 | 100 |
| 1-4-18 | 105.9 |
| 2-1 | 135.3 |
| 2-1-1 | 123.5 |
| 2-2 | 105.9 |
| 2-6 | 182.4 |
| 2-6-5 | 70.6 |
| 3-1 | 129.4 |
| 3-2 | 23.5 |
| 3-4 | 52.9 |
| 3-5 | 64.7 |
| 4-1 | 64.7 |
| 4-1-1 | 100 |
| 4-2 | 88.2 |
| 4-3 | 82.4 |
| 4-3-2 | 100 |
| 5-1 | 58.8 |
| 5-2 | 58.8 |
| 5-3 | 117.6 |
| 5-4 | 76.5 |
| 5-5 | 123.5 |
| 6-1 | 76.5 |
| 6-2 | 129.4 |
| 6-4 | 47.1 |
| 7-1 | 123.5 |
| 7-3 | 123.5 |
| 7-4 | 76.5 |
| 7-4-1 | 100 |
| 7-5 | 147.1 |
| 7-5-5 | 111.8 |
| 8-1 | 100 |
| 8-1-1 | 111.8 |
| 8-1-5 | 111.8 |
| 8-2 | 64.7 |
| 8-2-1 | 82.4 |
| 8-3 | 94.1 |
| 8-3-1 | 94.1 |
| 9-1 | 88.2 |
| 9-1-2 | 111.8 |
| 9-2 | 100 |
| 9-2-5 | 111.8 |
| 9-2-6 | 47.1 |
| 9-3 | 111.8 |
| 9-3-1 | 105.9 |
| 9-3-2 | 88.2 |
| 10-1 | 100 |
| 10-1-1 | 76.5 |
| 10-2 | 82.4 |
| 10-2-2 | 88.2 |
| 10-3 | 76.5 |
| 11-1 | 82.4 |
| 11-2 | 82.4 |
| 11-3 | 76.5 |
| 11-4 | 135.3 |
| 11-4-1 | 105.9 |
| 12-1 | 82.4 |
| 12-1-1 | 100 |
| 12-2 | 47.1 |
| 12-3 | 47.1 |
| 12-3-1 | 64.7 |
| 12-4 | 82.4 |
| 12-4-1 | 152.9 |
* Note
|