 |
 |
 |
 |
 |
 |
 |
 |
 |
 |
 |
 |
| Relative malic acid level (percent of control)* Experiment: flavor related metabolite profiling in S. pennellii IL lines (FL, Spring 2003, Field) |
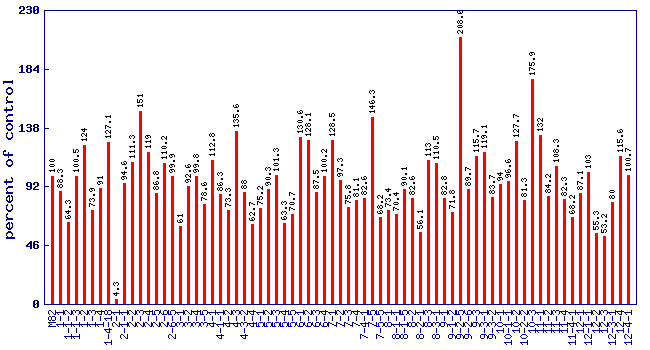 |
| line | relative level (percent of control) |
|---|---|
| M82 | 100 |
| 1-1 | 88.3 |
| 1-1-2 | 64.3 |
| 1-1-3 | 100.5 |
| 1-2 | 124 |
| 1-3 | 73.9 |
| 1-4 | 91 |
| 1-4-18 | 127.1 |
| 2-1 | 4.3 |
| 2-1-1 | 94.6 |
| 2-2 | 111.3 |
| 2-3 | 151 |
| 2-4 | 119 |
| 2-5 | 86.8 |
| 2-6 | 110.2 |
| 2-6-5 | 99.9 |
| 3-1 | 61 |
| 3-2 | 92.6 |
| 3-4 | 99.8 |
| 3-5 | 78.6 |
| 4-1 | 112.8 |
| 4-1-1 | 86.3 |
| 4-2 | 73.3 |
| 4-3 | 135.6 |
| 4-3-2 | 88 |
| 4-4 | 62.7 |
| 5-1 | 75.2 |
| 5-2 | 90.3 |
| 5-3 | 101.3 |
| 5-4 | 63.3 |
| 5-5 | 70.7 |
| 6-1 | 130.6 |
| 6-2 | 128.1 |
| 6-3 | 87.5 |
| 6-4 | 100.2 |
| 7-1 | 128.5 |
| 7-2 | 97.3 |
| 7-3 | 75.8 |
| 7-4 | 81.1 |
| 7-4-1 | 82.6 |
| 7-5 | 146.3 |
| 7-5-5 | 68.2 |
| 8-1 | 73.4 |
| 8-1-1 | 70.4 |
| 8-1-5 | 90.1 |
| 8-2 | 82.6 |
| 8-2-1 | 56.1 |
| 8-3 | 113 |
| 8-3-1 | 110.5 |
| 9-1 | 82.8 |
| 9-1-2 | 71.8 |
| 9-2-5 | 208.6 |
| 9-2-6 | 89.7 |
| 9-3 | 115.7 |
| 9-3-1 | 119.1 |
| 9-3-2 | 83.7 |
| 10-1 | 94 |
| 10-1-1 | 96.6 |
| 10-2 | 127.7 |
| 10-2-2 | 81.3 |
| 10-3 | 175.9 |
| 11-1 | 132 |
| 11-2 | 84.2 |
| 11-3 | 108.3 |
| 11-4 | 82.3 |
| 11-4-1 | 68.2 |
| 12-1 | 87.1 |
| 12-1-1 | 103 |
| 12-2 | 55.3 |
| 12-3 | 53.2 |
| 12-3-1 | 80 |
| 12-4 | 115.6 |
| 12-4-1 | 100.7 |
* Note
|