 |
 |
 |
 |
 |
 |
 |
 |
 |
 |
 |
 |
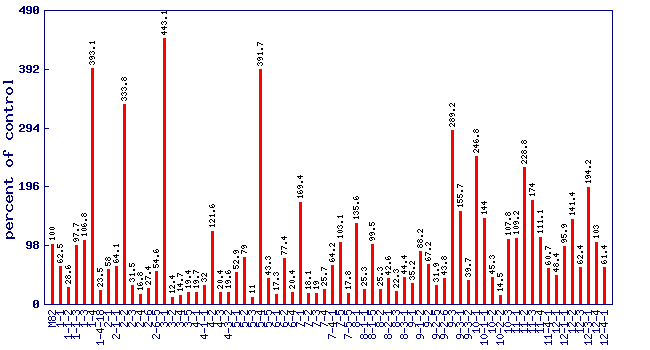
| Relative methyl benzoate level (percent of control)* Experiment: flavor related metabolite profiling in S. pennellii IL lines (FL, Fall 2002, Greenhouse) |
 |
| line | relative level (percent of control) |
|---|---|
| M82 | 100 |
| 1-1 | 62.5 |
| 1-1-2 | 28.6 |
| 1-1-3 | 97.7 |
| 1-3 | 106.8 |
| 1-4 | 393.1 |
| 1-4-18 | 23.5 |
| 2-1 | 58 |
| 2-1-1 | 64.1 |
| 2-2 | 333.8 |
| 2-3 | 31.5 |
| 2-4 | 16.8 |
| 2-6 | 27.4 |
| 2-6-5 | 54.6 |
| 3-1 | 443.1 |
| 3-2 | 12.4 |
| 3-4 | 14.7 |
| 3-5 | 19.4 |
| 4-1 | 19.7 |
| 4-1-1 | 32 |
| 4-2 | 121.6 |
| 4-3 | 20.4 |
| 4-3-2 | 19.6 |
| 5-1 | 52.9 |
| 5-2 | 79 |
| 5-3 | 11 |
| 5-4 | 391.7 |
| 5-5 | 43.3 |
| 6-1 | 17.3 |
| 6-2 | 77.4 |
| 6-4 | 20.4 |
| 7-1 | 169.4 |
| 7-2 | 18.1 |
| 7-3 | 19 |
| 7-4 | 25.7 |
| 7-4-1 | 64.2 |
| 7-5 | 103.1 |
| 7-5-5 | 17.8 |
| 8-1 | 135.6 |
| 8-1-1 | 25.3 |
| 8-1-5 | 99.5 |
| 8-2 | 25.3 |
| 8-2-1 | 42.6 |
| 8-3 | 22.3 |
| 8-3-1 | 44.4 |
| 9-1 | 35.2 |
| 9-1-2 | 88.2 |
| 9-2 | 67.2 |
| 9-2-5 | 31.9 |
| 9-2-6 | 43.8 |
| 9-3 | 289.2 |
| 9-3-1 | 155.7 |
| 9-3-2 | 39.7 |
| 10-1 | 246.8 |
| 10-1-1 | 144 |
| 10-2 | 45.3 |
| 10-2-2 | 14.5 |
| 10-3 | 107.8 |
| 11-1 | 109.2 |
| 11-2 | 228.8 |
| 11-3 | 174 |
| 11-4 | 111.1 |
| 11-4-1 | 60.7 |
| 12-1 | 48.4 |
| 12-1-1 | 95.9 |
| 12-2 | 141.4 |
| 12-3 | 62.4 |
| 12-3-1 | 194.2 |
| 12-4 | 103 |
| 12-4-1 | 61.4 |
* Note
|