 |
 |
 |
 |
 |
 |
 |
 |
 |
 |
 |
 |
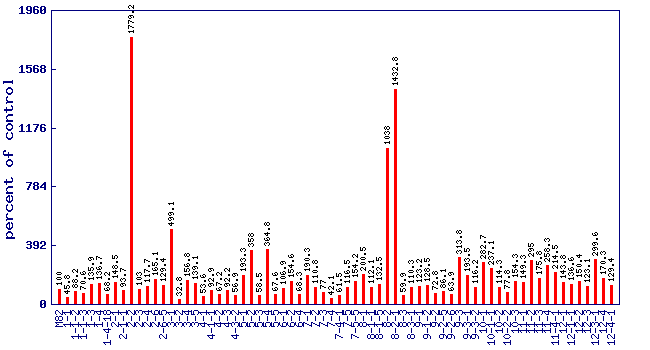
| Relative phenylacetaldehyde level (percent of control)* Experiment: flavor related metabolite profiling in S. pennellii IL lines (FL, Fall 2002, Greenhouse) |
 |
| line | relative level (percent of control) |
|---|---|
| M82 | 100 |
| 1-1 | 45.8 |
| 1-1-2 | 88.2 |
| 1-1-3 | 70.6 |
| 1-3 | 135.9 |
| 1-4 | 136.7 |
| 1-4-18 | 68.2 |
| 2-1 | 148.5 |
| 2-1-1 | 93.7 |
| 2-2 | 1779.2 |
| 2-3 | 103 |
| 2-4 | 117.7 |
| 2-6 | 165.1 |
| 2-6-5 | 129.4 |
| 3-1 | 499.1 |
| 3-2 | 32.8 |
| 3-4 | 156.8 |
| 3-5 | 139.1 |
| 4-1 | 53.6 |
| 4-1-1 | 92.9 |
| 4-2 | 67.2 |
| 4-3 | 92.2 |
| 4-3-2 | 56.9 |
| 5-1 | 193.3 |
| 5-2 | 358 |
| 5-3 | 58.5 |
| 5-4 | 364.8 |
| 5-5 | 67.6 |
| 6-1 | 106.9 |
| 6-2 | 154.6 |
| 6-4 | 68.3 |
| 7-1 | 190.3 |
| 7-2 | 110.8 |
| 7-3 | 77 |
| 7-4 | 42.1 |
| 7-4-1 | 61.5 |
| 7-5 | 116.5 |
| 7-5-5 | 154.2 |
| 8-1 | 200.5 |
| 8-1-1 | 112.1 |
| 8-1-5 | 132.5 |
| 8-2 | 1038 |
| 8-2-1 | 1432.8 |
| 8-3 | 59.9 |
| 8-3-1 | 110.3 |
| 9-1 | 123.2 |
| 9-1-2 | 128.5 |
| 9-2 | 72.8 |
| 9-2-5 | 86.1 |
| 9-2-6 | 63.9 |
| 9-3 | 313.8 |
| 9-3-1 | 193.5 |
| 9-3-2 | 116.2 |
| 10-1 | 282.7 |
| 10-1-1 | 237.1 |
| 10-2 | 114.3 |
| 10-2-2 | 77.8 |
| 10-3 | 154.3 |
| 11-1 | 149.3 |
| 11-2 | 295 |
| 11-3 | 175.8 |
| 11-4 | 258.3 |
| 11-4-1 | 214.5 |
| 12-1 | 143.8 |
| 12-1-1 | 136.6 |
| 12-2 | 150.4 |
| 12-3 | 123.1 |
| 12-3-1 | 299.6 |
| 12-4 | 170.3 |
| 12-4-1 | 129.4 |
* Note
|