 |
 |
 |
 |
 |
 |
 |
 |
 |
 |
 |
 |
| Relative phenylacetaldehyde level (percent of control)* Experiment: flavor related metabolite profiling in S. pennellii IL lines (FL, Spring 2003, Field) |
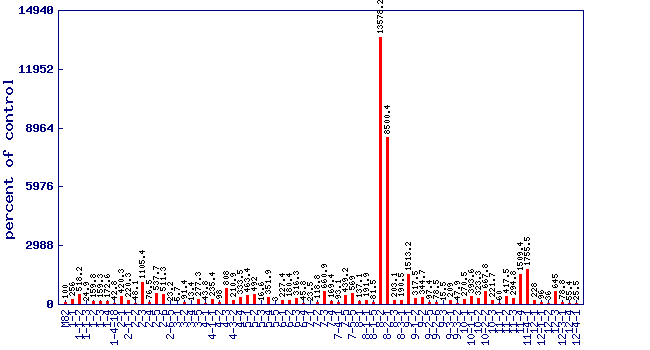 |
| line | relative level (percent of control) |
|---|---|
| M82 | 100 |
| 1-1 | 256 |
| 1-1-2 | 518.2 |
| 1-1-3 | 24.9 |
| 1-2 | 159.8 |
| 1-3 | 159.3 |
| 1-4 | 172.6 |
| 1-4-18 | 42.8 |
| 2-1 | 420.3 |
| 2-1-1 | 220.3 |
| 2-2 | 48.1 |
| 2-3 | 1105.4 |
| 2-4 | 76.5 |
| 2-5 | 537.7 |
| 2-6 | 511.3 |
| 2-6-5 | 23.2 |
| 3-1 | 5.7 |
| 3-2 | 91.4 |
| 3-4 | 13.4 |
| 3-5 | 277.3 |
| 4-1 | 43.8 |
| 4-1-1 | 235.4 |
| 4-2 | 98 |
| 4-3 | 808 |
| 4-3-2 | 210.9 |
| 4-4 | 333.5 |
| 5-1 | 463.4 |
| 5-2 | 492 |
| 5-3 | 16.6 |
| 5-4 | 351.9 |
| 5-5 | 3 |
| 6-1 | 227.4 |
| 6-2 | 180.4 |
| 6-3 | 316.3 |
| 6-4 | 45.8 |
| 7-1 | 23.5 |
| 7-2 | 118.8 |
| 7-3 | 660.9 |
| 7-4 | 169.4 |
| 7-4-1 | 93.1 |
| 7-5 | 439.2 |
| 7-5-5 | 569 |
| 8-1 | 137.1 |
| 8-1-1 | 191.9 |
| 8-1-5 | 81.5 |
| 8-2 | 13578.2 |
| 8-2-1 | 8500.4 |
| 8-3 | 203.1 |
| 8-3-1 | 190.5 |
| 9-1 | 1513.2 |
| 9-1-2 | 317.5 |
| 9-2 | 344.7 |
| 9-2-5 | 97.4 |
| 9-2-6 | 78.5 |
| 9-3 | 15.5 |
| 9-3-1 | 209 |
| 9-3-2 | 47.9 |
| 10-1 | 270.5 |
| 10-1-1 | 393.6 |
| 10-2 | 323.3 |
| 10-2-2 | 667.8 |
| 10-3 | 221.7 |
| 11-1 | 60 |
| 11-2 | 417.5 |
| 11-3 | 294.8 |
| 11-4 | 1509.4 |
| 11-4-1 | 1755.5 |
| 12-1 | 228 |
| 12-1-1 | 96 |
| 12-2 | 36 |
| 12-3 | 645 |
| 12-3-1 | 78.8 |
| 12-4 | 55.4 |
| 12-4-1 | 25.5 |
* Note
|