 |
 |
 |
 |
 |
 |
 |
 |
 |
 |
 |
 |
| Relative soluble solids level (percent of control)* Experiment: flavor related metabolite profiling in S. pennellii IL lines (FL, Fall 2003, Field) |
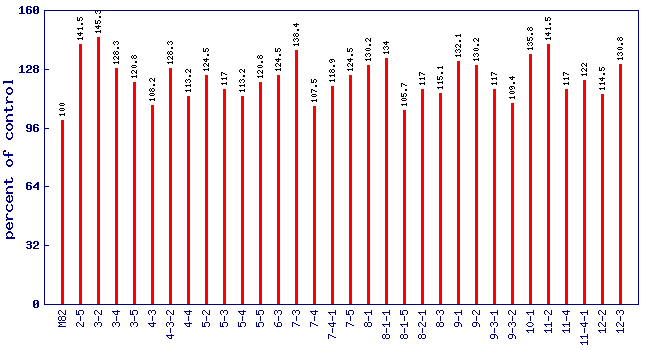 |
| line | relative level (percent of control) |
|---|---|
| M82 | 100 |
| 2-5 | 141.5 |
| 3-2 | 145.3 |
| 3-4 | 128.3 |
| 3-5 | 120.8 |
| 4-3 | 108.2 |
| 4-3-2 | 128.3 |
| 4-4 | 113.2 |
| 5-2 | 124.5 |
| 5-3 | 117 |
| 5-4 | 113.2 |
| 5-5 | 120.8 |
| 6-3 | 124.5 |
| 7-3 | 138.4 |
| 7-4 | 107.5 |
| 7-4-1 | 118.9 |
| 7-5 | 124.5 |
| 8-1 | 130.2 |
| 8-1-1 | 134 |
| 8-1-5 | 105.7 |
| 8-2-1 | 117 |
| 8-3 | 115.1 |
| 9-1 | 132.1 |
| 9-2 | 130.2 |
| 9-3-1 | 117 |
| 9-3-2 | 109.4 |
| 10-1 | 135.8 |
| 11-2 | 141.5 |
| 11-4 | 117 |
| 11-4-1 | 122 |
| 12-2 | 114.5 |
| 12-3 | 130.8 |
* Note
|