Relative trans-2-cis-6-nonadienal level (percent of control)*
Experiment: flavor related metabolite profiling in S. pennellii IL lines (combined)
|
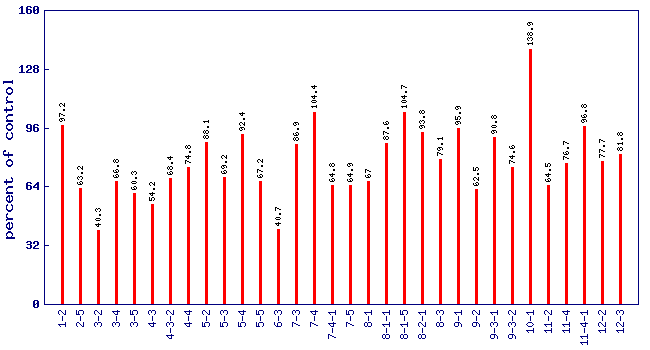 |
| line | relative level (percent of control) | p value | FDR |
|---|
| 1-2 | 97.2 | 0.949198 | 0.978091 |
| 2-5 | 63.2 | 0.217545 | 0.489943 |
| 3-2 | 40.3 | 0.0121467 | 0.0736294 |
| 3-4 | 66.8 | 0.35935 | 0.643392 |
| 3-5 | 60.3 | 0.174413 | 0.430193 |
| 4-3 | 54.2 | 0.100927 | 0.307474 |
| 4-3-2 | 68.4 | 0.292027 | 0.579723 |
| 4-4 | 74.8 | 0.419907 | 0.691438 |
| 5-2 | 88.1 | 0.733401 | 0.894275 |
| 5-3 | 69.2 | 0.343944 | 0.628698 |
| 5-4 | 92.4 | 0.870512 | 0.945929 |
| 5-5 | 67.2 | 0.284841 | 0.572078 |
| 6-3 | 40.7 | 0.0212763 | 0.109302 |
| 7-3 | 86.9 | 0.686489 | 0.867922 |
| 7-4 | 104.4 | 0.922418 | 0.966264 |
| 7-4-1 | 64.8 | 0.227945 | 0.502699 |
| 7-5 | 64.9 | 0.217155 | 0.489943 |
| 8-1 | 67 | 0.252128 | 0.533679 |
| 8-1-1 | 87.6 | 0.722799 | 0.885382 |
| 8-1-5 | 104.7 | 0.911249 | 0.960511 |
| 8-2-1 | 93.8 | 0.858609 | 0.939302 |
| 8-3 | 79.1 | 0.528157 | 0.779833 |
| 9-1 | 95.9 | 0.909436 | 0.960511 |
| 9-2 | 62.5 | 0.19243 | 0.456569 |
| 9-3-1 | 90.8 | 0.794925 | 0.914804 |
| 9-3-2 | 74.6 | 0.390978 | 0.668546 |
| 10-1 | 138.9 | 0.377246 | 0.657463 |
| 11-2 | 64.5 | 0.239597 | 0.51828 |
| 11-4 | 76.7 | 0.494257 | 0.756193 |
| 11-4-1 | 96.8 | 0.92626 | 0.96771 |
| 12-2 | 77.7 | 0.483583 | 0.748619 |
| 12-3 | 81.8 | 0.575077 | 0.812904 |
* Note
- A value of zero means the trans-2-cis-6-nonadienal concentration wasbelow the level of dection
- No measure of trans-2-cis-6-nonadienal was performed on lines notshown in the figure and table
|
|


