 |
 |
 |
 |
 |
 |
 |
 |
 |
 |
 |
 |
| Relative trans-2-heptenal level (percent of control)* Experiment: flavor related metabolite profiling in S. pennellii IL lines (FL, Fall 2002, Greenhouse) |
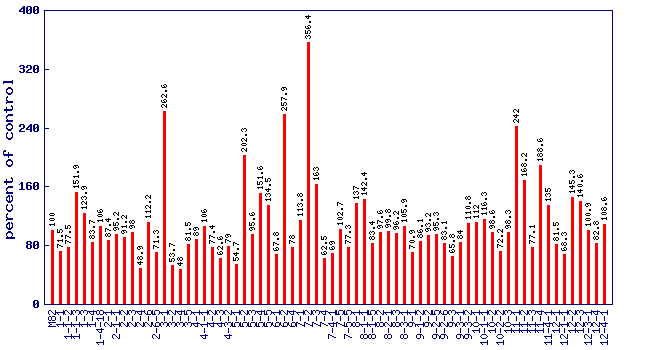 |
| line | relative level (percent of control) |
|---|---|
| M82 | 100 |
| 1-1 | 71.5 |
| 1-1-2 | 77.5 |
| 1-1-3 | 151.9 |
| 1-3 | 123.9 |
| 1-4 | 83.7 |
| 1-4-18 | 106 |
| 2-1 | 87.4 |
| 2-1-1 | 95.2 |
| 2-2 | 91.2 |
| 2-3 | 98 |
| 2-4 | 48.9 |
| 2-6 | 112.2 |
| 2-6-5 | 71.3 |
| 3-1 | 262.6 |
| 3-2 | 53.7 |
| 3-4 | 48 |
| 3-5 | 81.5 |
| 4-1 | 89 |
| 4-1-1 | 106 |
| 4-2 | 77.4 |
| 4-3 | 62.6 |
| 4-3-2 | 79 |
| 5-1 | 54.7 |
| 5-2 | 202.3 |
| 5-3 | 95.6 |
| 5-4 | 151.6 |
| 5-5 | 134.5 |
| 6-1 | 67.8 |
| 6-2 | 257.9 |
| 6-4 | 78 |
| 7-1 | 113.8 |
| 7-2 | 356.4 |
| 7-3 | 163 |
| 7-4 | 62.5 |
| 7-4-1 | 69 |
| 7-5 | 102.7 |
| 7-5-5 | 77.3 |
| 8-1 | 137 |
| 8-1-1 | 142.4 |
| 8-1-5 | 83.4 |
| 8-2 | 97.6 |
| 8-2-1 | 99.8 |
| 8-3 | 96.2 |
| 8-3-1 | 105.9 |
| 9-1 | 70.9 |
| 9-1-2 | 86.1 |
| 9-2 | 93.2 |
| 9-2-5 | 95.3 |
| 9-2-6 | 83.1 |
| 9-3 | 65.8 |
| 9-3-1 | 84 |
| 9-3-2 | 110.8 |
| 10-1 | 112 |
| 10-1-1 | 116.3 |
| 10-2 | 98.6 |
| 10-2-2 | 72.2 |
| 10-3 | 98.3 |
| 11-1 | 242 |
| 11-2 | 168.2 |
| 11-3 | 77.1 |
| 11-4 | 188.6 |
| 11-4-1 | 135 |
| 12-1 | 81.5 |
| 12-1-1 | 68.3 |
| 12-2 | 145.3 |
| 12-3 | 140.6 |
| 12-3-1 | 100.9 |
| 12-4 | 82.8 |
| 12-4-1 | 108.6 |
* Note
|