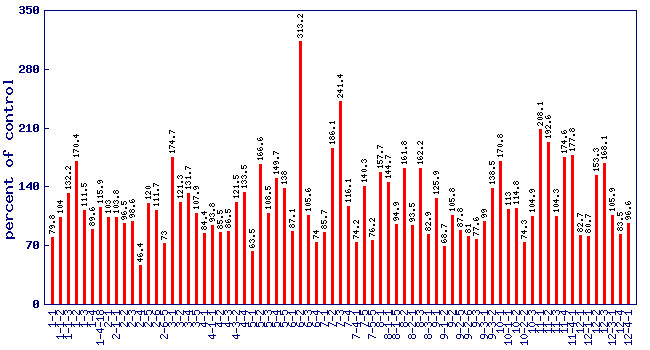
Relative trans-2-heptenal level (percent of control)*
Experiment: flavor related metabolite profiling in S. pennellii IL lines (combined)
|
 |
| line | relative level (percent of control) | p value | FDR |
|---|
| 1-1 | 79.8 | 0.349205 | 0.633892 |
| 1-1-2 | 104 | 0.865763 | 0.941637 |
| 1-1-3 | 132.2 | 0.217415 | 0.489943 |
| 1-2 | 170.4 | 0.0851403 | 0.271728 |
| 1-3 | 111.5 | 0.651342 | 0.855635 |
| 1-4 | 89.6 | 0.673036 | 0.865723 |
| 1-4-18 | 115.9 | 0.52687 | 0.779398 |
| 2-1 | 103 | 0.919406 | 0.964395 |
| 2-1-1 | 103.8 | 0.860831 | 0.940611 |
| 2-2 | 96.5 | 0.895999 | 0.956276 |
| 2-3 | 98.6 | 0.958298 | 0.981163 |
| 2-4 | 46.4 | 0.0128839 | 0.076371 |
| 2-5 | 120 | 0.486893 | 0.751862 |
| 2-6 | 111.7 | 0.65756 | 0.858179 |
| 2-6-5 | 73 | 0.227295 | 0.502308 |
| 3-1 | 174.7 | 0.0324237 | 0.140429 |
| 3-2 | 121.3 | 0.369893 | 0.650415 |
| 3-4 | 131.7 | 0.272847 | 0.557993 |
| 3-5 | 107.9 | 0.711561 | 0.877542 |
| 4-1 | 84.4 | 0.466014 | 0.734379 |
| 4-1-1 | 93.8 | 0.80677 | 0.919165 |
| 4-2 | 85.5 | 0.501716 | 0.762273 |
| 4-3 | 86.5 | 0.489965 | 0.754137 |
| 4-3-2 | 121.5 | 0.35294 | 0.637726 |
| 4-4 | 133.5 | 0.250513 | 0.530839 |
| 5-1 | 63.5 | 0.0591352 | 0.207501 |
| 5-2 | 166.6 | 0.0176249 | 0.0946686 |
| 5-3 | 108.5 | 0.711271 | 0.877542 |
| 5-4 | 149.7 | 0.140041 | 0.376238 |
| 5-5 | 138 | 0.153892 | 0.396153 |
| 6-1 | 87.1 | 0.678978 | 0.867827 |
| 6-2 | 313.2 | 0.024998 | 0.119414 |
| 6-3 | 105.6 | 0.833682 | 0.933439 |
| 6-4 | 74 | 0.296795 | 0.583202 |
| 7-1 | 85.7 | 0.52264 | 0.776166 |
| 7-2 | 186.1 | 0.0627904 | 0.217097 |
| 7-3 | 241.4 | 0.000109034 | 0.00184966 |
| 7-4 | 116.1 | 0.521101 | 0.77524 |
| 7-4-1 | 74.2 | 0.146538 | 0.38694 |
| 7-5 | 140.3 | 0.107499 | 0.321272 |
| 7-5-5 | 76.2 | 0.275922 | 0.561367 |
| 8-1 | 157.7 | 0.0393415 | 0.160511 |
| 8-1-1 | 144.7 | 0.0725173 | 0.244629 |
| 8-1-5 | 94.9 | 0.793684 | 0.914804 |
| 8-2 | 161.8 | 0.149177 | 0.391453 |
| 8-2-1 | 93.5 | 0.705267 | 0.877095 |
| 8-3 | 162.2 | 0.032457 | 0.140429 |
| 8-3-1 | 82.9 | 0.405501 | 0.679507 |
| 9-1 | 125.9 | 0.272046 | 0.557328 |
| 9-1-2 | 68.7 | 0.149244 | 0.391453 |
| 9-2 | 105.8 | 0.757173 | 0.902305 |
| 9-2-5 | 87.8 | 0.525298 | 0.778049 |
| 9-2-6 | 81 | 0.397704 | 0.675098 |
| 9-3 | 77.6 | 0.274794 | 0.560524 |
| 9-3-1 | 99 | 0.959293 | 0.98135 |
| 9-3-2 | 138.5 | 0.0766938 | 0.252223 |
| 10-1 | 170.8 | 0.0107551 | 0.0669143 |
| 10-1-1 | 113 | 0.588355 | 0.822289 |
| 10-2 | 114.8 | 0.613631 | 0.832139 |
| 10-2-2 | 74.3 | 0.335711 | 0.622211 |
| 10-3 | 104.9 | 0.853059 | 0.938414 |
| 11-1 | 208.1 | 0.00339553 | 0.0291757 |
| 11-2 | 192.6 | 0.00180661 | 0.0172469 |
| 11-3 | 104.3 | 0.877355 | 0.94748 |
| 11-4 | 174.6 | 0.0113393 | 0.0699951 |
| 11-4-1 | 177.8 | 0.00621237 | 0.0447974 |
| 12-1 | 82.7 | 0.414396 | 0.685716 |
| 12-1-1 | 80.7 | 0.409647 | 0.680817 |
| 12-2 | 153.3 | 0.0259135 | 0.122208 |
| 12-3 | 168.1 | 0.00771346 | 0.0516714 |
| 12-3-1 | 105.9 | 0.796089 | 0.91525 |
| 12-4 | 83.5 | 0.43826 | 0.708792 |
| 12-4-1 | 96.6 | 0.87757 | 0.94748 |
* Note
- A value of zero means the trans-2-heptenal concentration wasbelow the level of dection
- No measure of trans-2-heptenal was performed on lines notshown in the figure and table
|
|


