 |
 |
 |
 |
 |
 |
 |
 |
 |
 |
 |
 |
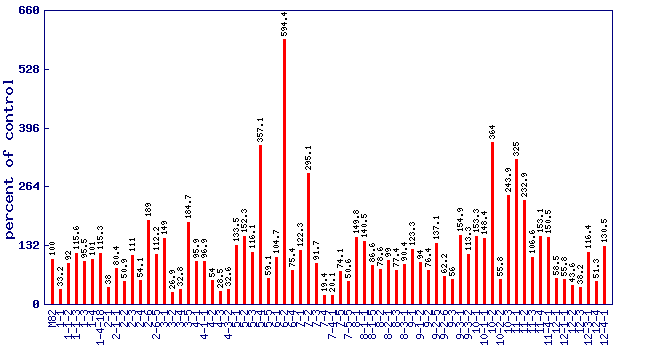
| Relative trans-2-hexenal level (percent of control)* Experiment: flavor related metabolite profiling in S. pennellii IL lines (FL, Fall 2002, Greenhouse) |
 |
| line | relative level (percent of control) |
|---|---|
| M82 | 100 |
| 1-1 | 33.2 |
| 1-1-2 | 92 |
| 1-1-3 | 115.6 |
| 1-3 | 95.5 |
| 1-4 | 101 |
| 1-4-18 | 115.3 |
| 2-1 | 38 |
| 2-1-1 | 80.4 |
| 2-2 | 50.9 |
| 2-3 | 111 |
| 2-4 | 54.1 |
| 2-6 | 189 |
| 2-6-5 | 112.2 |
| 3-1 | 149 |
| 3-2 | 26.9 |
| 3-4 | 32.8 |
| 3-5 | 184.7 |
| 4-1 | 95.9 |
| 4-1-1 | 96.9 |
| 4-2 | 54 |
| 4-3 | 28.5 |
| 4-3-2 | 32.6 |
| 5-1 | 133.5 |
| 5-2 | 152.3 |
| 5-3 | 116.1 |
| 5-4 | 357.1 |
| 5-5 | 59.1 |
| 6-1 | 104.7 |
| 6-2 | 594.4 |
| 6-4 | 75.4 |
| 7-1 | 122.3 |
| 7-2 | 295.1 |
| 7-3 | 91.7 |
| 7-4 | 19.4 |
| 7-4-1 | 20.1 |
| 7-5 | 74.1 |
| 7-5-5 | 50.6 |
| 8-1 | 149.8 |
| 8-1-1 | 140.5 |
| 8-1-5 | 86.6 |
| 8-2 | 78.6 |
| 8-2-1 | 99 |
| 8-3 | 77.4 |
| 8-3-1 | 90.4 |
| 9-1 | 123.3 |
| 9-1-2 | 94 |
| 9-2 | 76.4 |
| 9-2-5 | 137.1 |
| 9-2-6 | 62.2 |
| 9-3 | 56 |
| 9-3-1 | 154.9 |
| 9-3-2 | 113.3 |
| 10-1 | 153.3 |
| 10-1-1 | 148.4 |
| 10-2 | 364 |
| 10-2-2 | 55.8 |
| 10-3 | 243.9 |
| 11-1 | 325 |
| 11-2 | 232.9 |
| 11-3 | 106.6 |
| 11-4 | 153.1 |
| 11-4-1 | 150.5 |
| 12-1 | 58.5 |
| 12-1-1 | 55.8 |
| 12-2 | 43.6 |
| 12-3 | 38.2 |
| 12-3-1 | 116.4 |
| 12-4 | 51.3 |
| 12-4-1 | 130.5 |
* Note
|